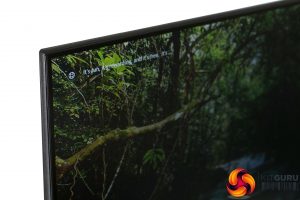
Starting with our initial subjective image quality impressions, as soon as you fire up the AOC 27V2Q it’s obvious you’re getting a decent quality display. Colours are punchy but accurate, there’s a decent level of contrast and viewing angles are good.
There are just two obvious downsides. The first is the resolution. The low pixel density means you can clearly see each individual pixel from a normal viewing distance – a retina display this isn’t.
However, if you have your display set a little further back on your desk or you just prefer the extra readability of larger pixels then it’s fine.
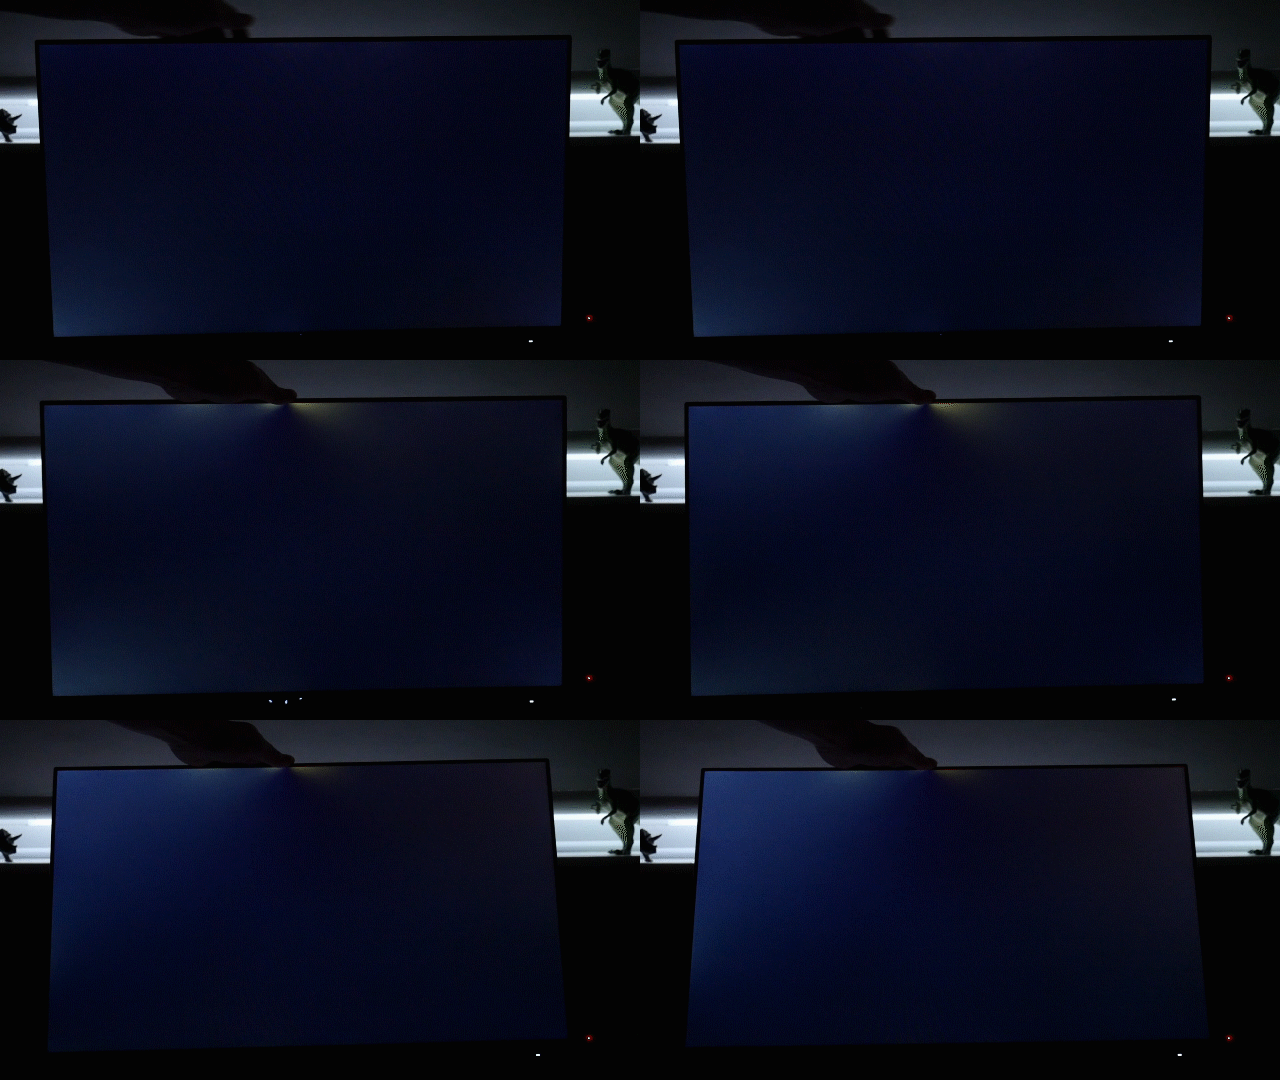
The other issue is IPS glow. This is where the backlight of the display shines through somewhat, making for a slightly washed out, grey looking image. This tends to only be visible when viewing the screen from a certain angle, such that it can sometimes be seen in the corners of a display when sat at a normal viewing distance. That’s also the case here but the extent to which it shines through is higher than with better quality panels.
The monitor is also very prone to the backlight bleeding through when touched or moved around, due to it being so thin. In general use neither is a major issue but again it’s something where higher quality displays do better.
With the ISO on our camera cranked up you can clearly see the IPS glow and backlight bleed as the display is moved around
Moving onto our objective testing and the 27V2Q doesn’t disappoint. We use two colorimeters for testing displays: the Xrite iDisplay Pro and Spyder5Elite. These are devices that are placed in front of the screen to measure the display’s output.
We start our testing with the Xrite iDisplay Pro colorimeter, which is used in conjunction with a piece of software called DisplayCal. We use this setup to test for contrast levels as the Spyder5Elite under reports this figure.
The 27V2Q managed a contrast ratio of 943:1, which is exactly in line with the 1000:1 contrast we’d expect of an IPS display. Some IPS displays can push a little higher than this (up to around 1200:1) but by and large you’re only going to get higher by opting for a VA panel or a display with a multi-zone backlight.
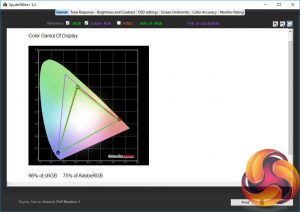
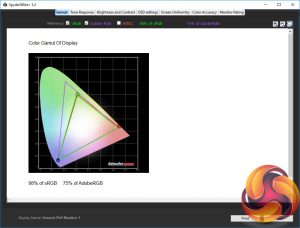
The rest of our objective image quality testing is done with the Sypder5Elite colorimeter and software, and the first test it performs is to see how much of the standard colour spaces a display covers. Ideally a display like this should cover 100% of the sRGB colour space (the standard for Windows PCs) and we can see that the 27V2Q manages 98%, which is a smidge less than we’d hope for.
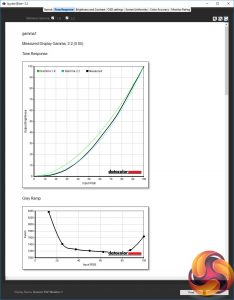
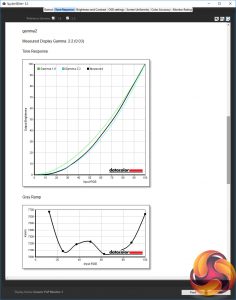
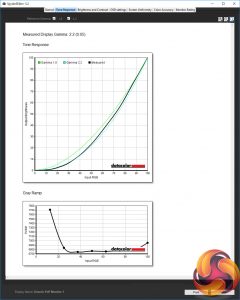
The next test checks for the gamma performance of the display. Gamma is a measure of the rate of change from light to dark such that a high gamma results in an image that looks darker, while a lower gamma results in a lighter-looking image. The standard for Windows PCs is 2.2 and, as we can see from our tests, the default gamma1 setting on the 27V2Q is a very close match.
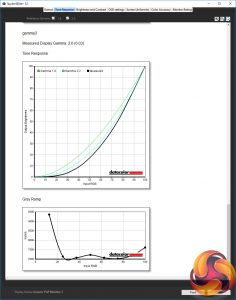
We also tested the gamma2 and gamma3 settings that were available in the OSD. Gamma2 was also reported as 2.2 but it’s clear from the graph and the change in the monitor’s image quality that this is meant to offer a slightly lower gamma option, with a resultant brighter image.
Meanwhile the gamma3 option does the opposite, with a measured gamma of 2.6 and a correspondingly darker looking image. In other words, just stick to the default gamma1 setting and you’ll be fine.
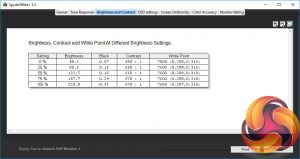
The brightness and contrast test shows us that the display offers a nice linear change in brightness as you ramp up the brightness setting. However, you’ll also note the maximum brightness isn’t very high. Most desktop monitors hit around 300nits maximum whereas this display tops out at 220nits.
This is still more than enough for most circumstances but if your desk happens to be in a particularly bright office – i.e. with direct sunlight shining on it – you may find the maximum brightness available here a bit limiting.
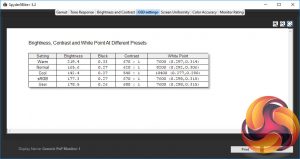
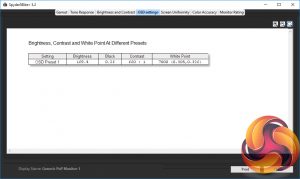
The OSD settings test allows us to test how the different colour profiles available in the display’s OSD affect image quality, and the main figure we’re looking at is the White Point. Here we’re normally looking to find a display delivers a White Point of 6500K by default, as this is the standard for Windows PCs.
Instead we can see that the default Warm colour setting, the sRGB setting and the User setting are all the same and are all a bit high. This results in the default image quality of this display being a bit on the blue side.
Opt for the Normal colour setting and the image gets even more blue, while the Cool option stretches this even further – we wouldn’t recommend opting for these. Opt for the User colour option and drop the blue channel just a touch and you should have perfect colour balance.
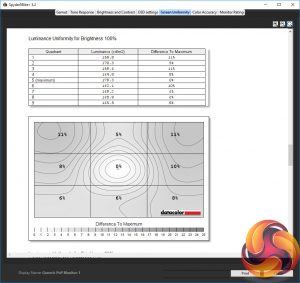
Our penultimate test is a crucial one for very thin screens like this: uniformity. Being able to provide a consist, uniform backlight from such a thin display is tricky, but the 27V2Q has largely managed it. The top corners are a little darker than ideal but an average brightness variance of 7.2% isn’t too bad.
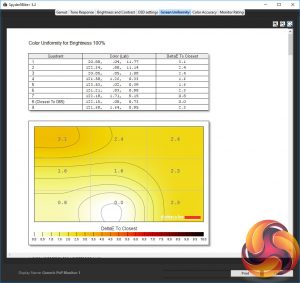
Likewise colour varies by an average Delta E of just 1.8 so colours by and large look the same across the whole surface.
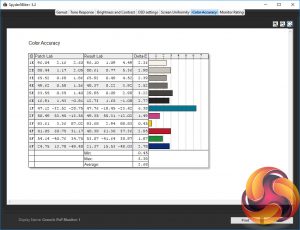
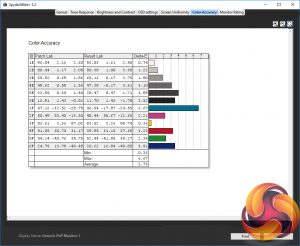
As for overall colour accuracy, this is an area where this display shows its more budget leanings. With an average Delta E of 2.68 and maximum of 6.38, this panel isn’t the best at differentiating between fine changes in colour, as we’d expect given the 6-bit panel. With better quality displays we’d hope for closer to 1 and 3 respectively for these figures.
All told, while we’ve picked out a few areas where this display isn’t perfect, by and large it delivers an image that’s perfectly usable right out the box. Professional image and video editors will want to opt for something a little more capable but for general use it is fine.
To try and get the very best image quality possible from this display we also calibrated it. This is a two step process where we use a colorimeter to measure the display’s performance then adjust the screen’s settings to get as close as possible to ideal settings. We then let the software do the rest of the correction – software calibration measures the output of a screen against the signal it’s sent and adjusts the signal such that the resultant colour from the display looks as it should.
Adjusting the screen, we changed the user colour mode’s RGB values from 50x50x50 to 50x49x45. This resulted in improved colour balance. We then ran a software calibration and received the below results.
As you can see, most results didn’t change a huge amount but the colour balance improved.
Gaming
The 27V2Q has a refresh rate of 75Hz, which offers a small improvement over typical 60Hz screens when it comes to gaming performance, and improves the general smoothness of the image when on the desktop, too.
The difference is small but noticeable. It’s probably not going to make the difference between you making a shot or not, but it does make gaming just a little more enjoyable, especially with the addition of Freesync to help smooth out tearing and stutter – assuming you’ve got a compatible AMD graphics card.
The BlurBusters ghosting test with the four different overdrive settings: Off, Low, Medium, Strong
The only notable adjustable setting on the display in regards to gaming is overdrive. This offers a reasonable range of options, from no overdrive where the image looks very soft, through to a strong setting that's much sharper but introduces really obvious inverse ghosting. Opting for the Medium setting provided a nice balance between the two.
 KitGuru KitGuru.net – Tech News | Hardware News | Hardware Reviews | IOS | Mobile | Gaming | Graphics Cards


