Our main test involves using an X-Rite i1 Display Pro Plus colorimeter and utilising Portrait Display's Calman Ultimate software. The device sits on top of the screen while the software generates colour tones and patterns, which it compares against predetermined values to work out how accurate the screen is.
The results show:
- A monitor’s maximum brightness in candelas or cd/m2 at various levels set in the OSD.
- A monitor’s contrast ratio at various brightness levels in the OSD.
- Gamut coverage, primarily focusing on sRGB and DCI-P3 colour spaces.
- Greyscale accuracy, measured across 20 shades, with an average colour balance reported.
- The exact gamma levels, with a comparison against preset settings in the OSD.
- The colour accuracy, expressed as a Delta E ratio, with a result under 3 being fine for normal use, and under 2 being great for colour-accurate design work.
We first run these tests with the display in its out-of-the-box state, with all settings on default. If there is an sRGB emulation option or other useful mode then we may test that too. We then calibrate the screen using the Calman Ultimate software and run the tests again.
You can read more about our test methodology HERE.
Default settings
Brightness and Contrast (Full Screen)
| OSD Brightness | White Luminance (cd/m2) | Black Luminance (cd/m2) | Contrast Ratio |
| 0% | 50.1 | 0.00 | ~Infinite |
| 25% | 97.0 | 0.00 | ~Infinite |
| 50% | 143.2 | 0.00 | ~Infinite |
| 75% | 189.8 | 0.00 | ~Infinite |
| 100% | 250.8 | 0.00 | ~Infinite |
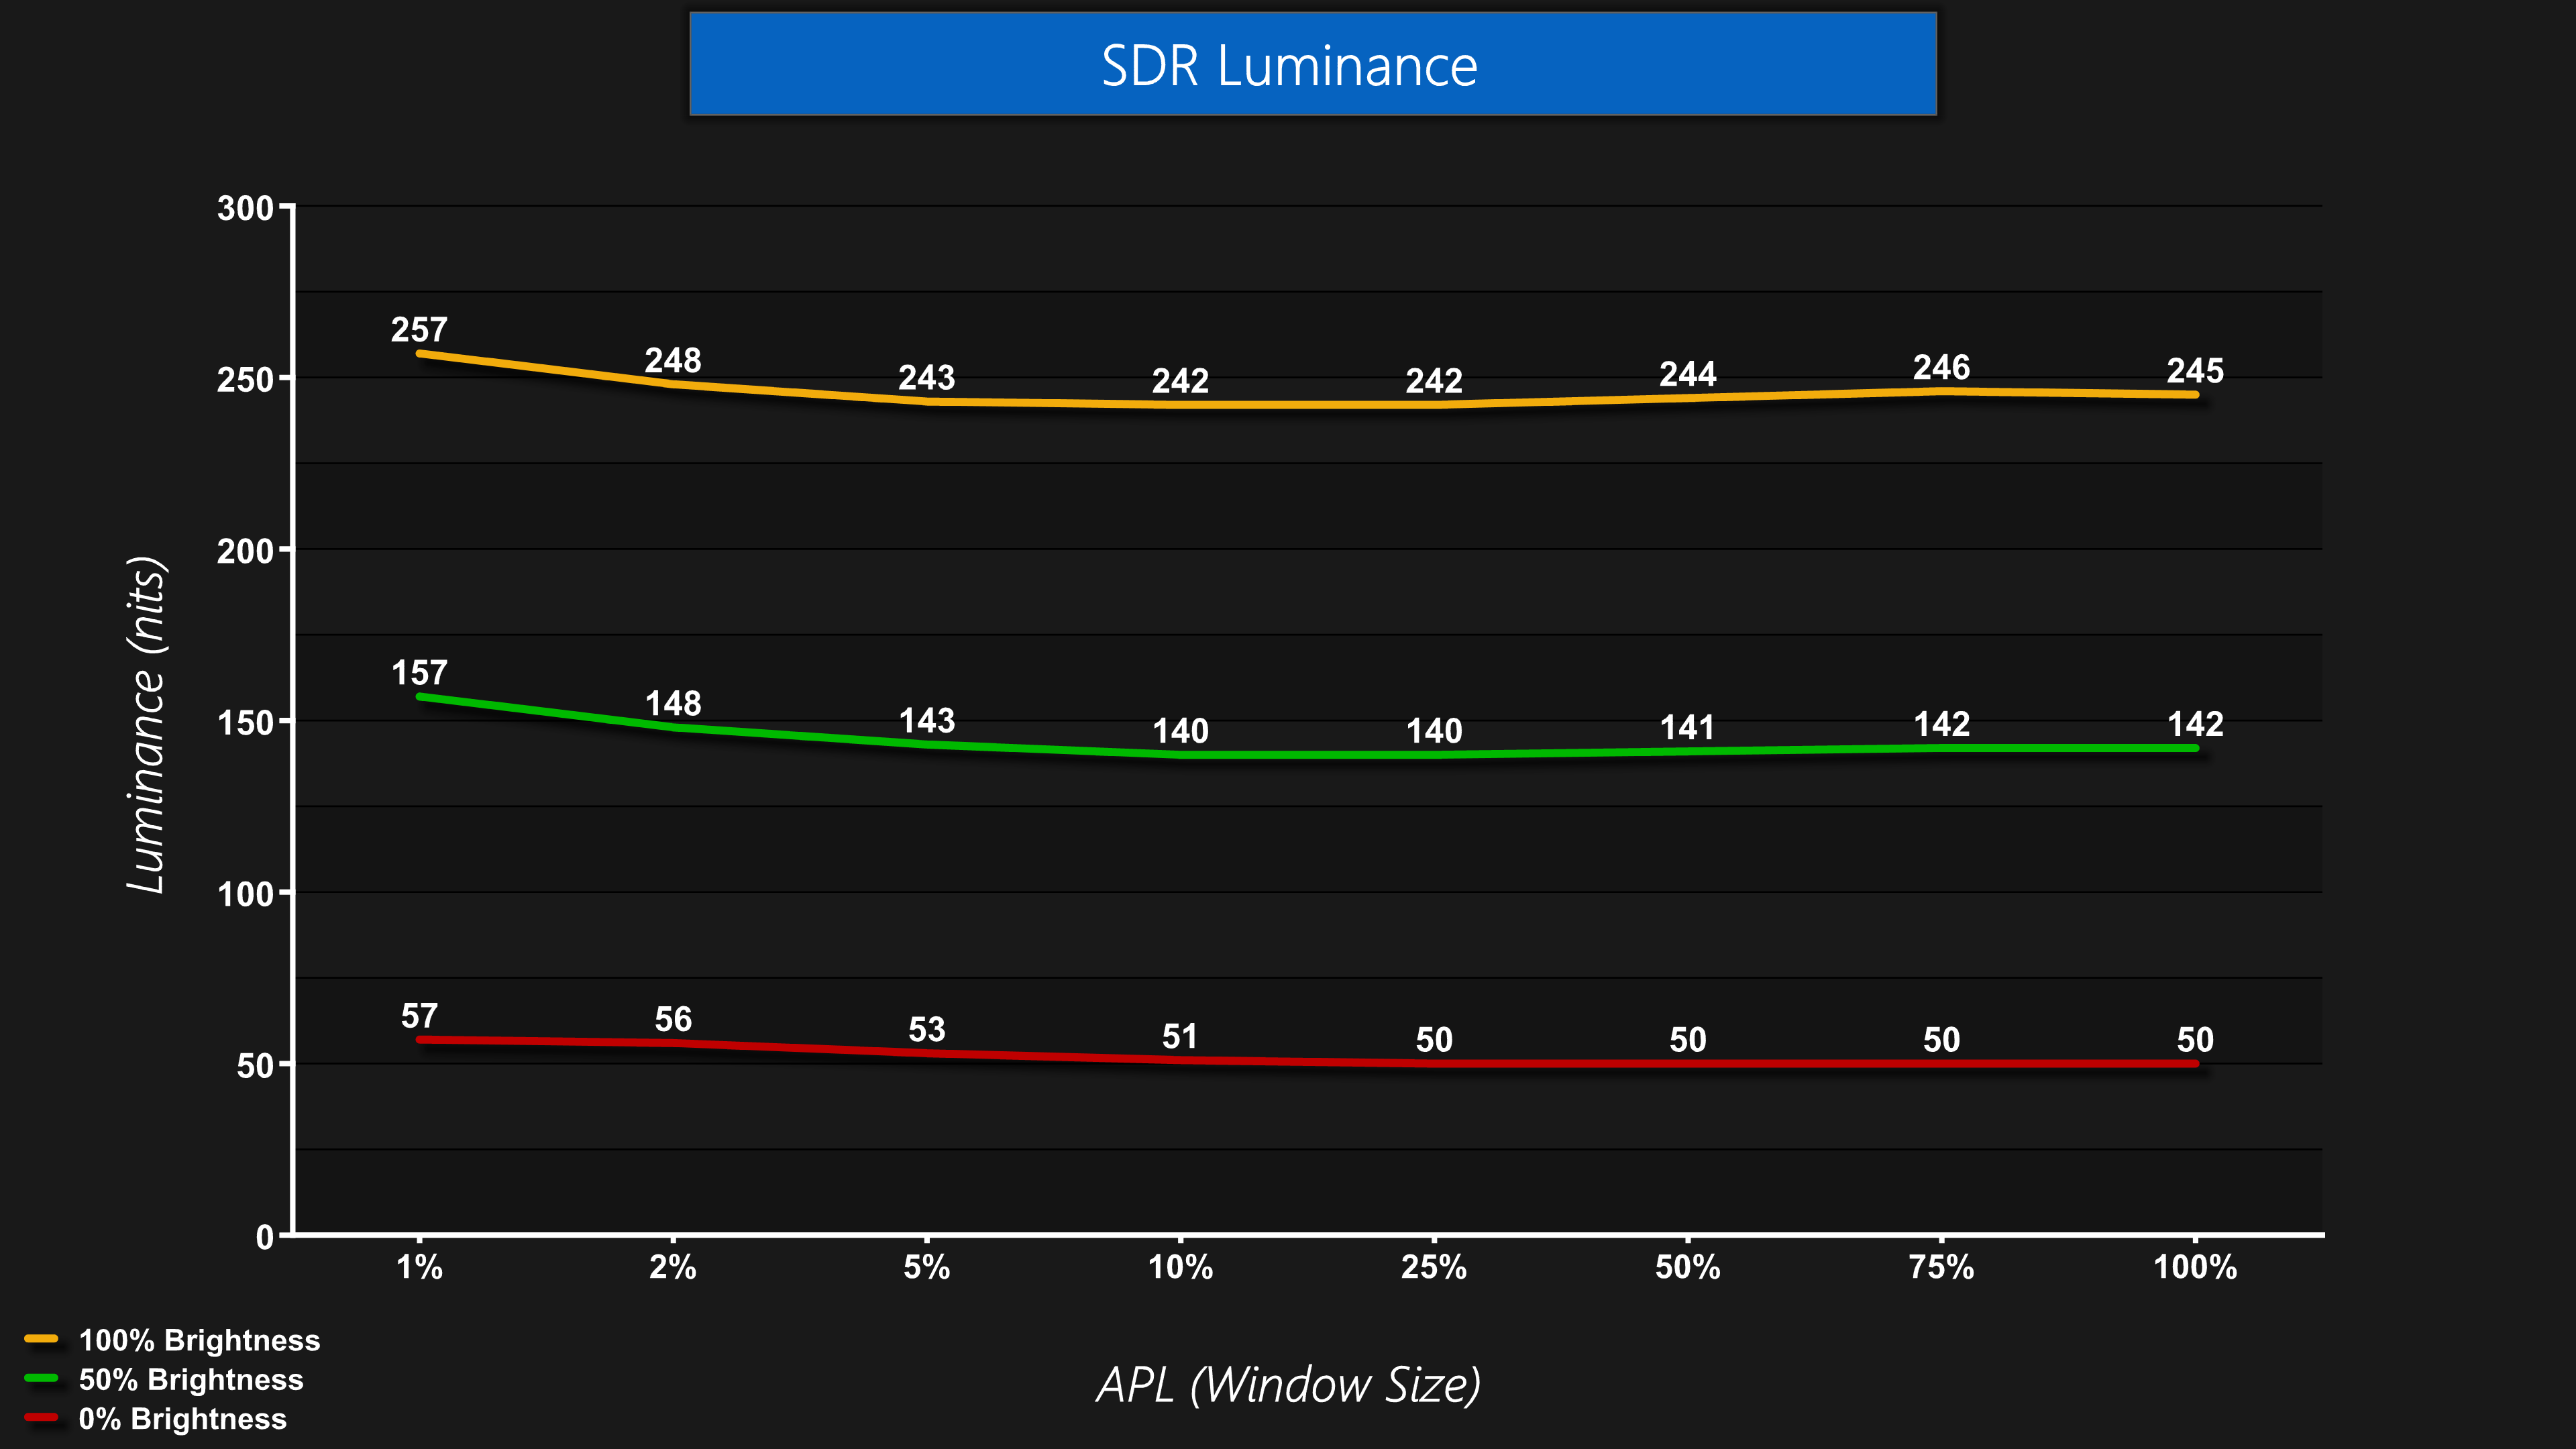
Kicking off with full screen brightness – or luminance, as is technically more accurate – we see a range of 50.1 to 250.8 nits from the 49M2C8900, and this is tested using a full screen 100% white image. Full screen brightness remains lower than LCD-based displays, but 250 nits is still a solid result and should be usable for almost everyone.
It's also good to see that luminance is very steady regardless of the window size (APL). Some OLED monitors will show a noticeable drop off in brightness as the window size gets bigger, but that is not the case for the 49M2C8900 – it's a very uniform experience in this regard.
Gamut (CIE 1976)
| Colour space | Coverage |
| sRGB | 143.9% |
| DCI-P3 | 99.2% |
| AdobeRGB | 97.3% |
| Rec.2020 | 83.4% |
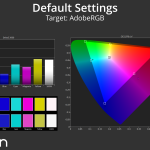
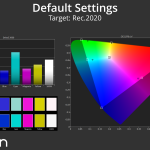
Being a QD-OLED we naturally get a very wide colour gamut from the 49M2C8900, far exceeding sRGB's colour space, and offering close to 100% coverage of both the DCI-P3 and AdobeRGB spaces. Rec.2020 coverage is also as expected, hitting 83%.
Greyscale
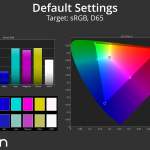
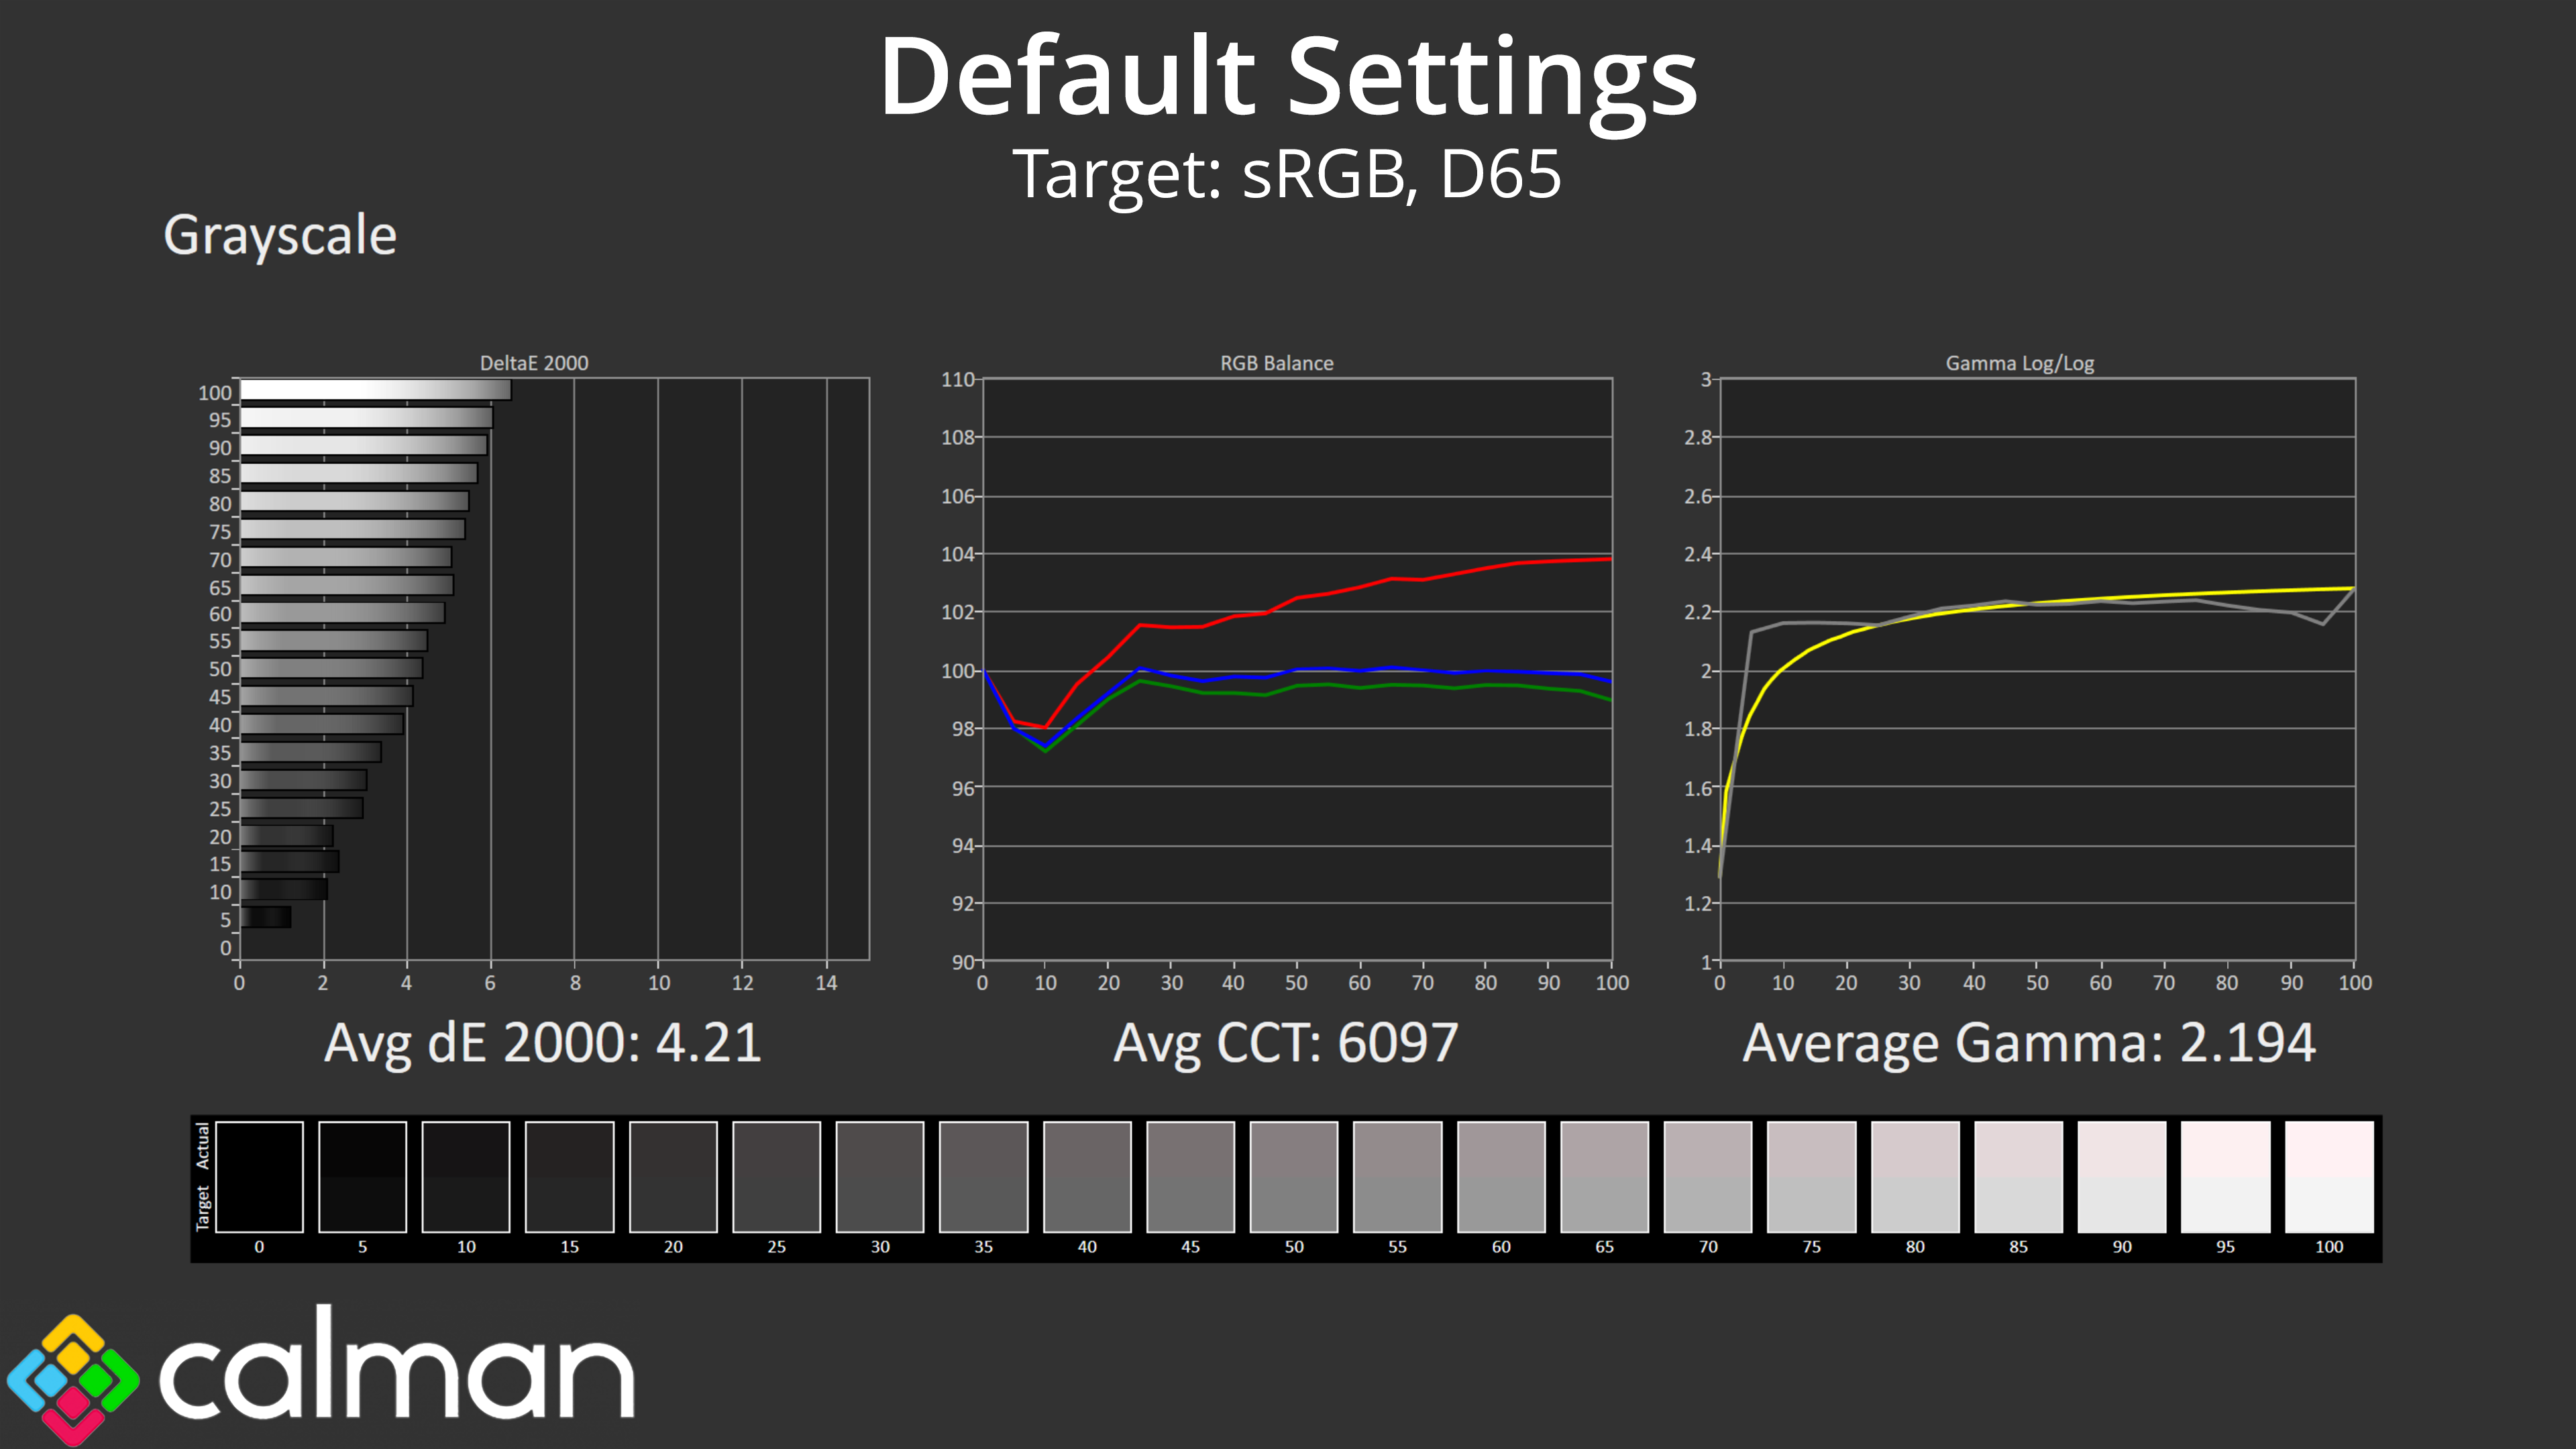
Moving onto greyscale performance, the default configuration isn't terrible but there is a definite red tint to the screen using the default ‘6500K' white balance setting, with an average CCT (Correlated Colour Temperature) of 6097K. That results in a higher-than-expected greyscale dE of 4.21. Gamma is pretty solid though, tracking the desired 2.2. curve closely.
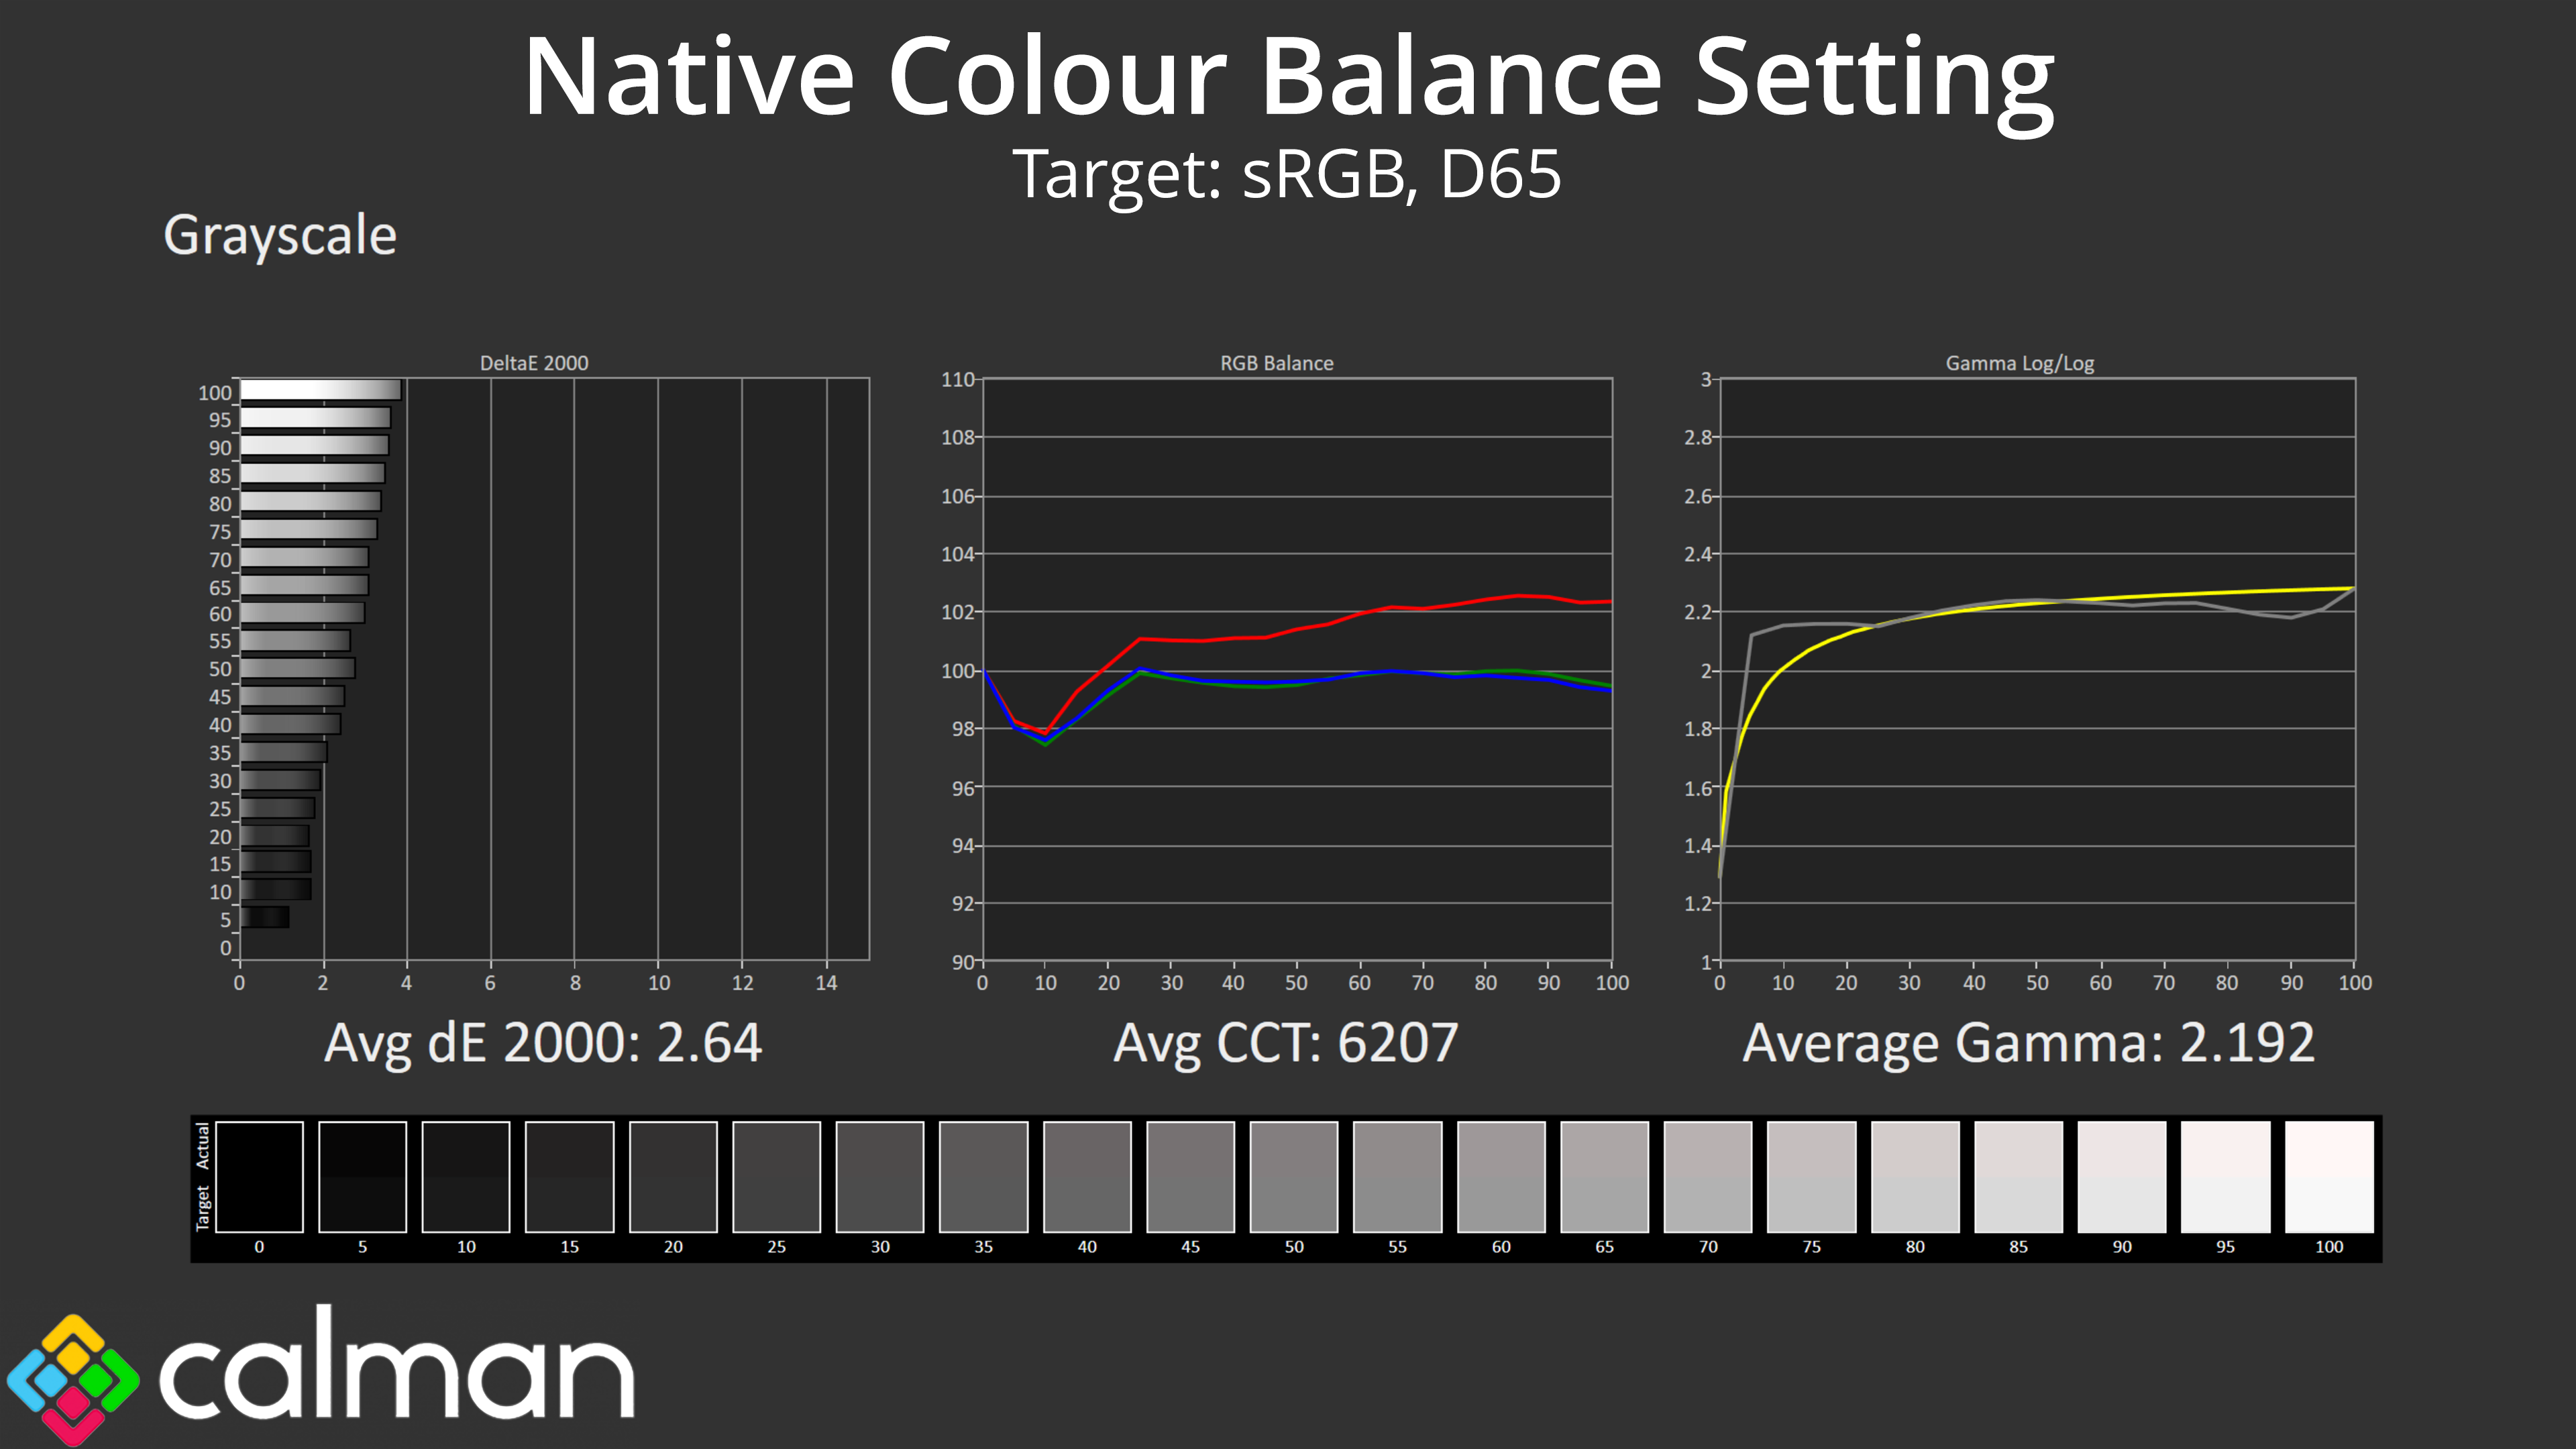
One frustration I have with the 49M2C8900 is that there is no user-configurable white balance. Out of the box it uses the ‘6500K' setting, which as we saw above, delivers results that are too warm. I also tried the ‘Native' white balance setting which adjusts the average CCT to 6207K and improves greyscale dE to 2.64. Things could be improved further still if it was possible to manually adjust the RGB balance of the monitor, but that is sadly missing from the 49M2C8900.
Saturation
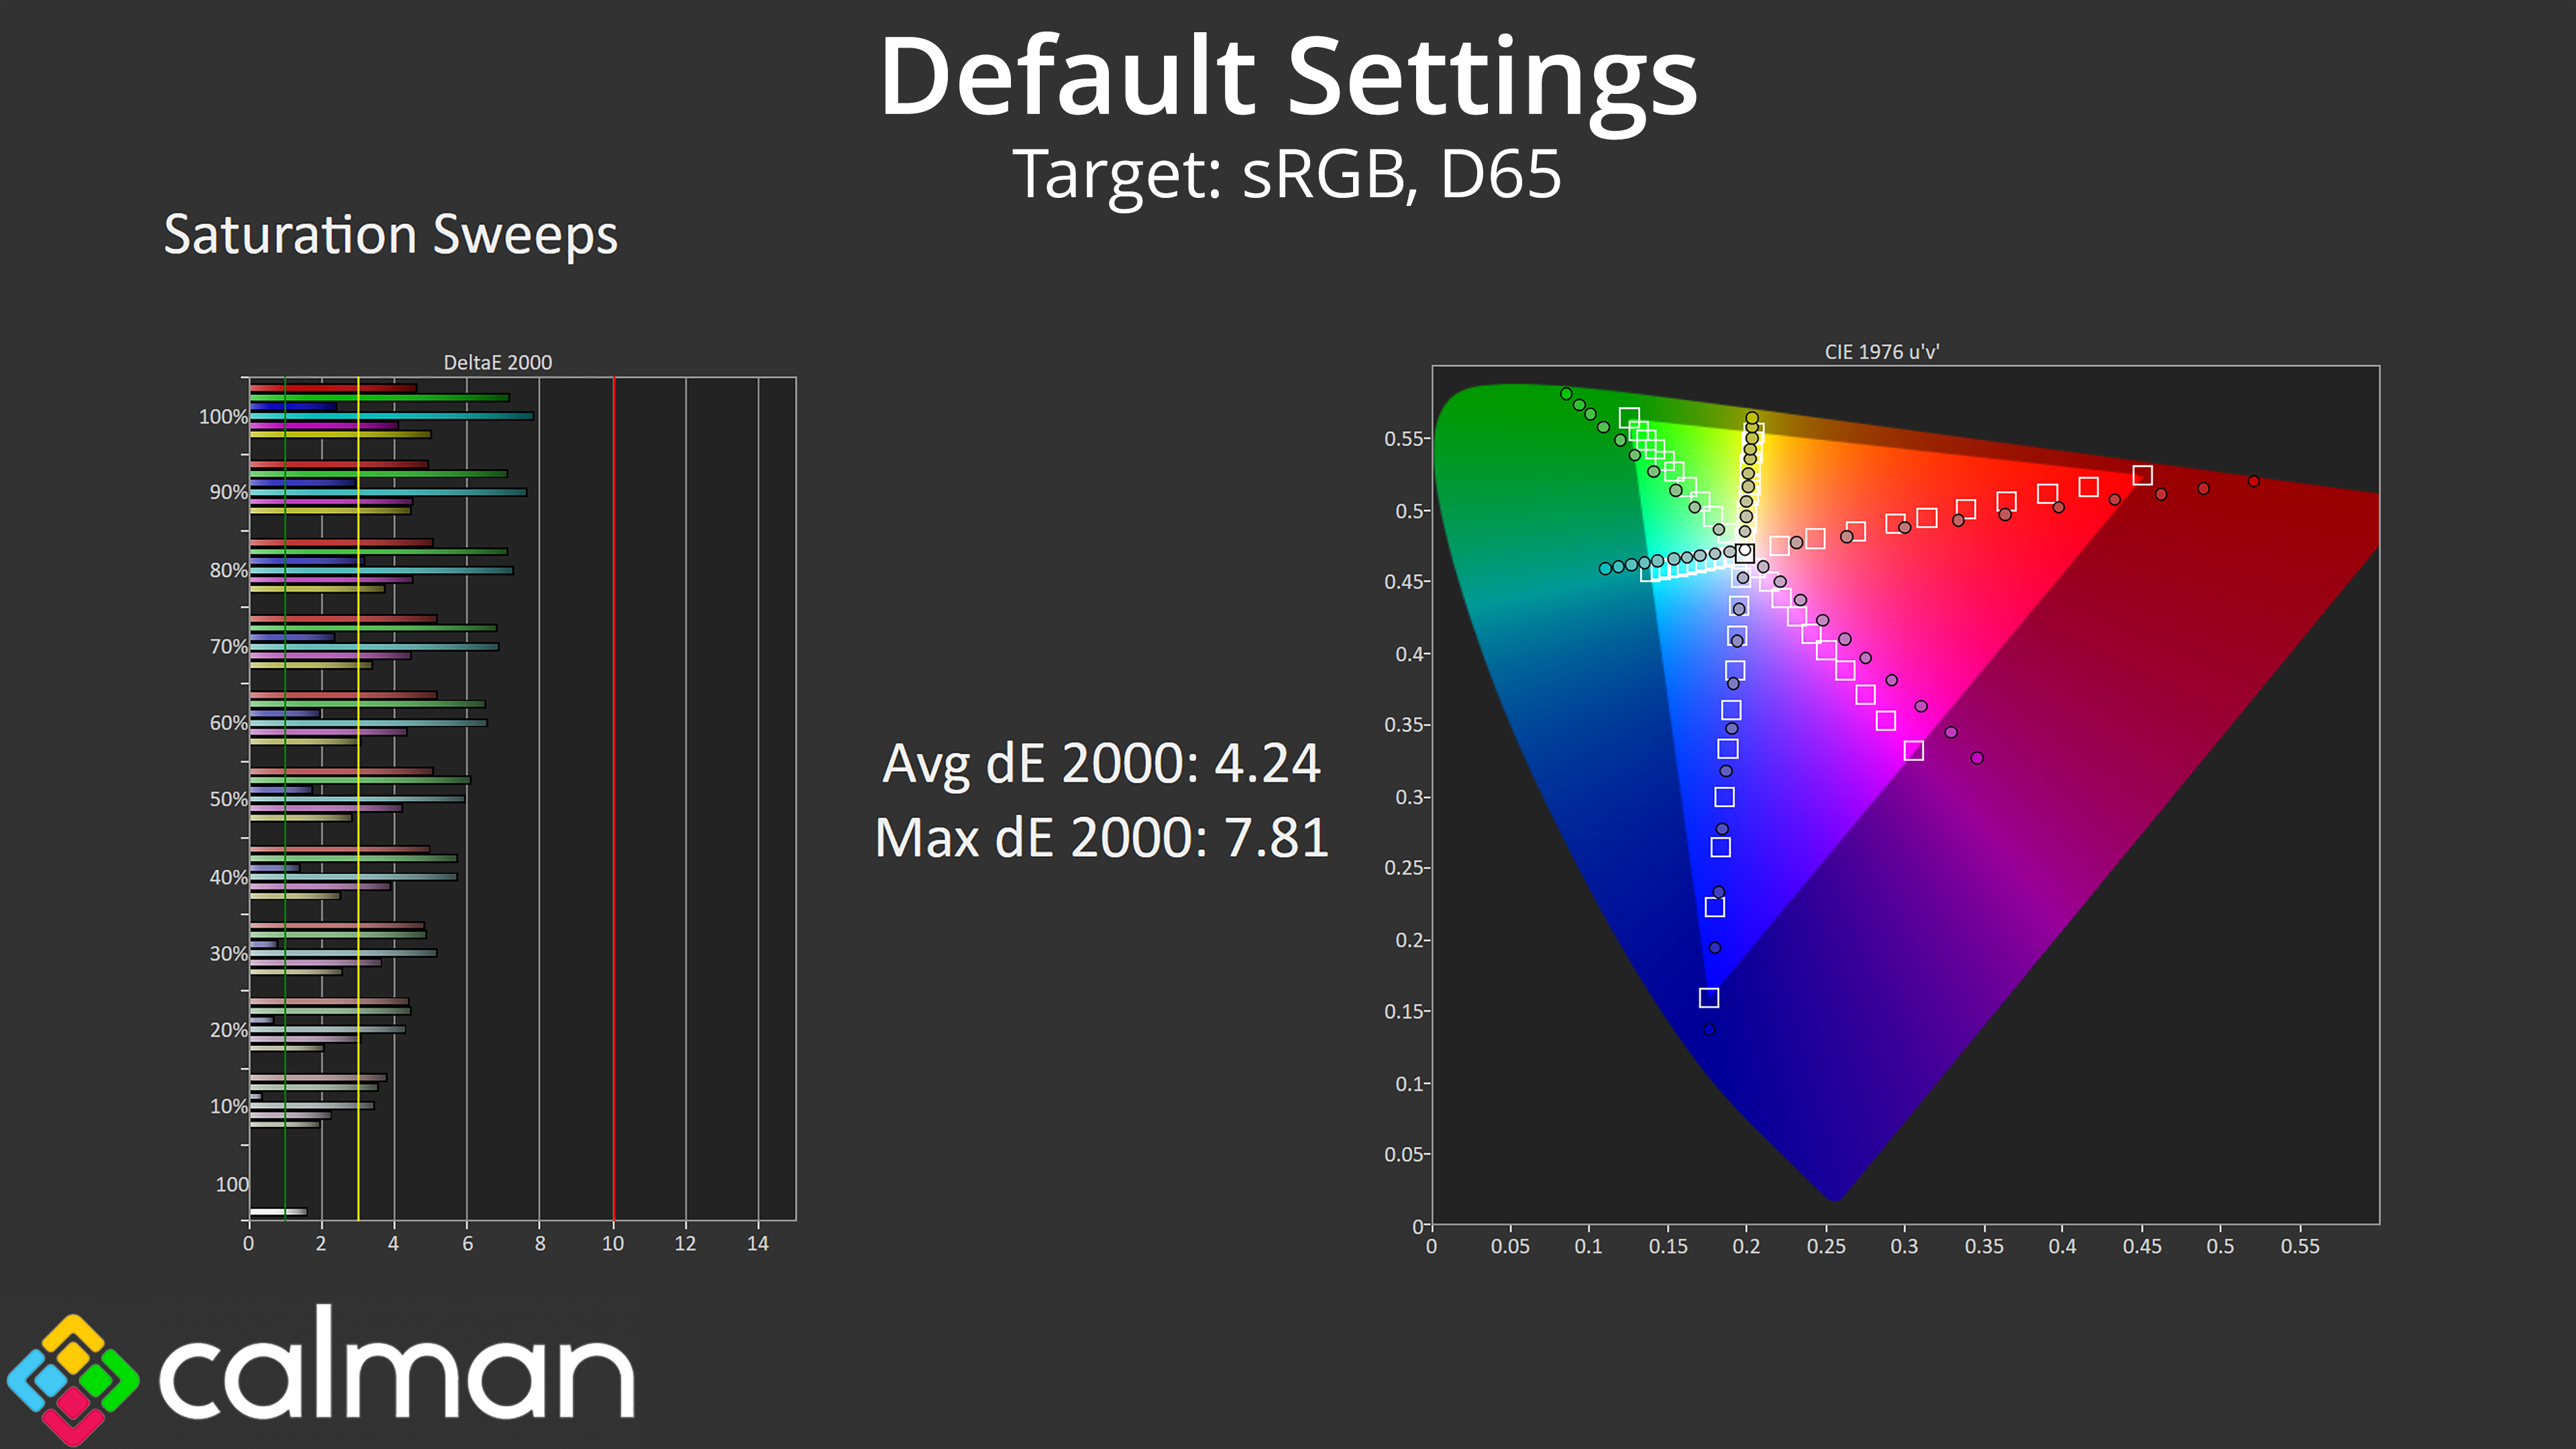
As expected from the QD-OLED panel, we see high levels of over-saturation when comparing against the sRGB colour space – this is completely normal as the screen's gamut is much wider than that of sRGB.
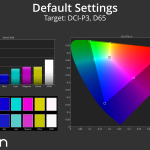
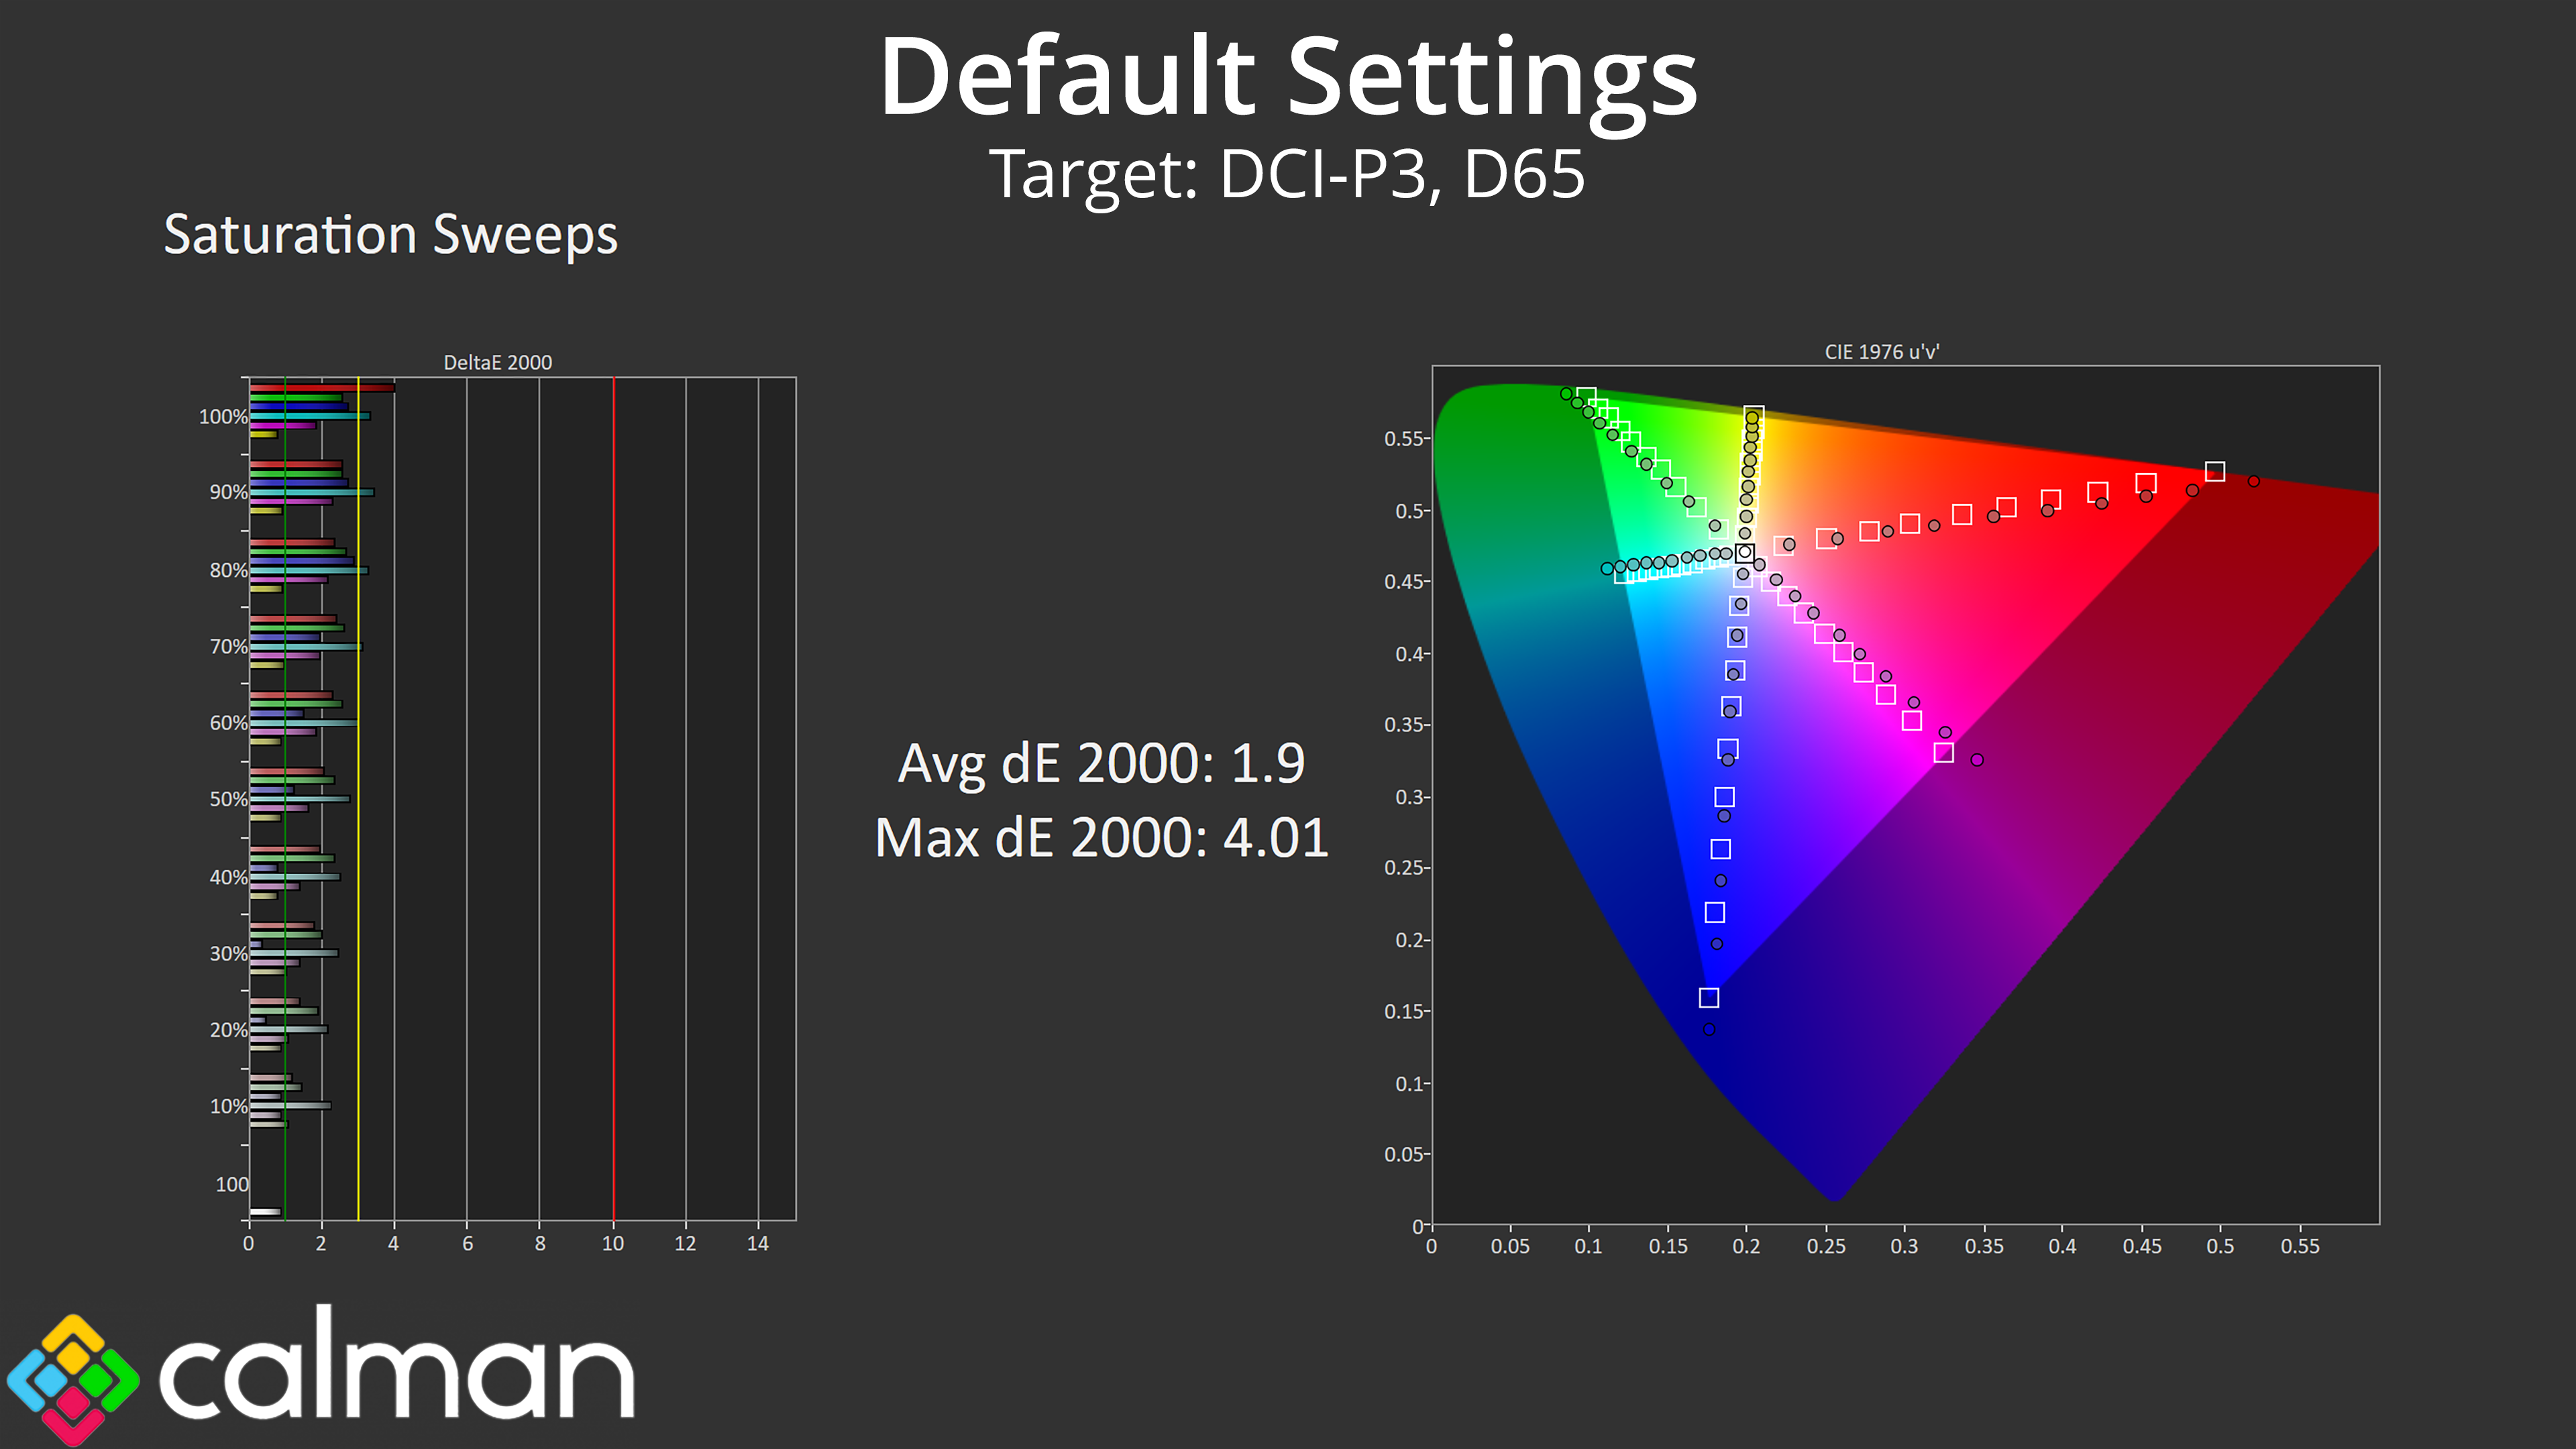
When looking at the saturation sweeps relative to DCI-P3, the results are much better – still not perfect, but much more acceptable.
Colour Accuracy
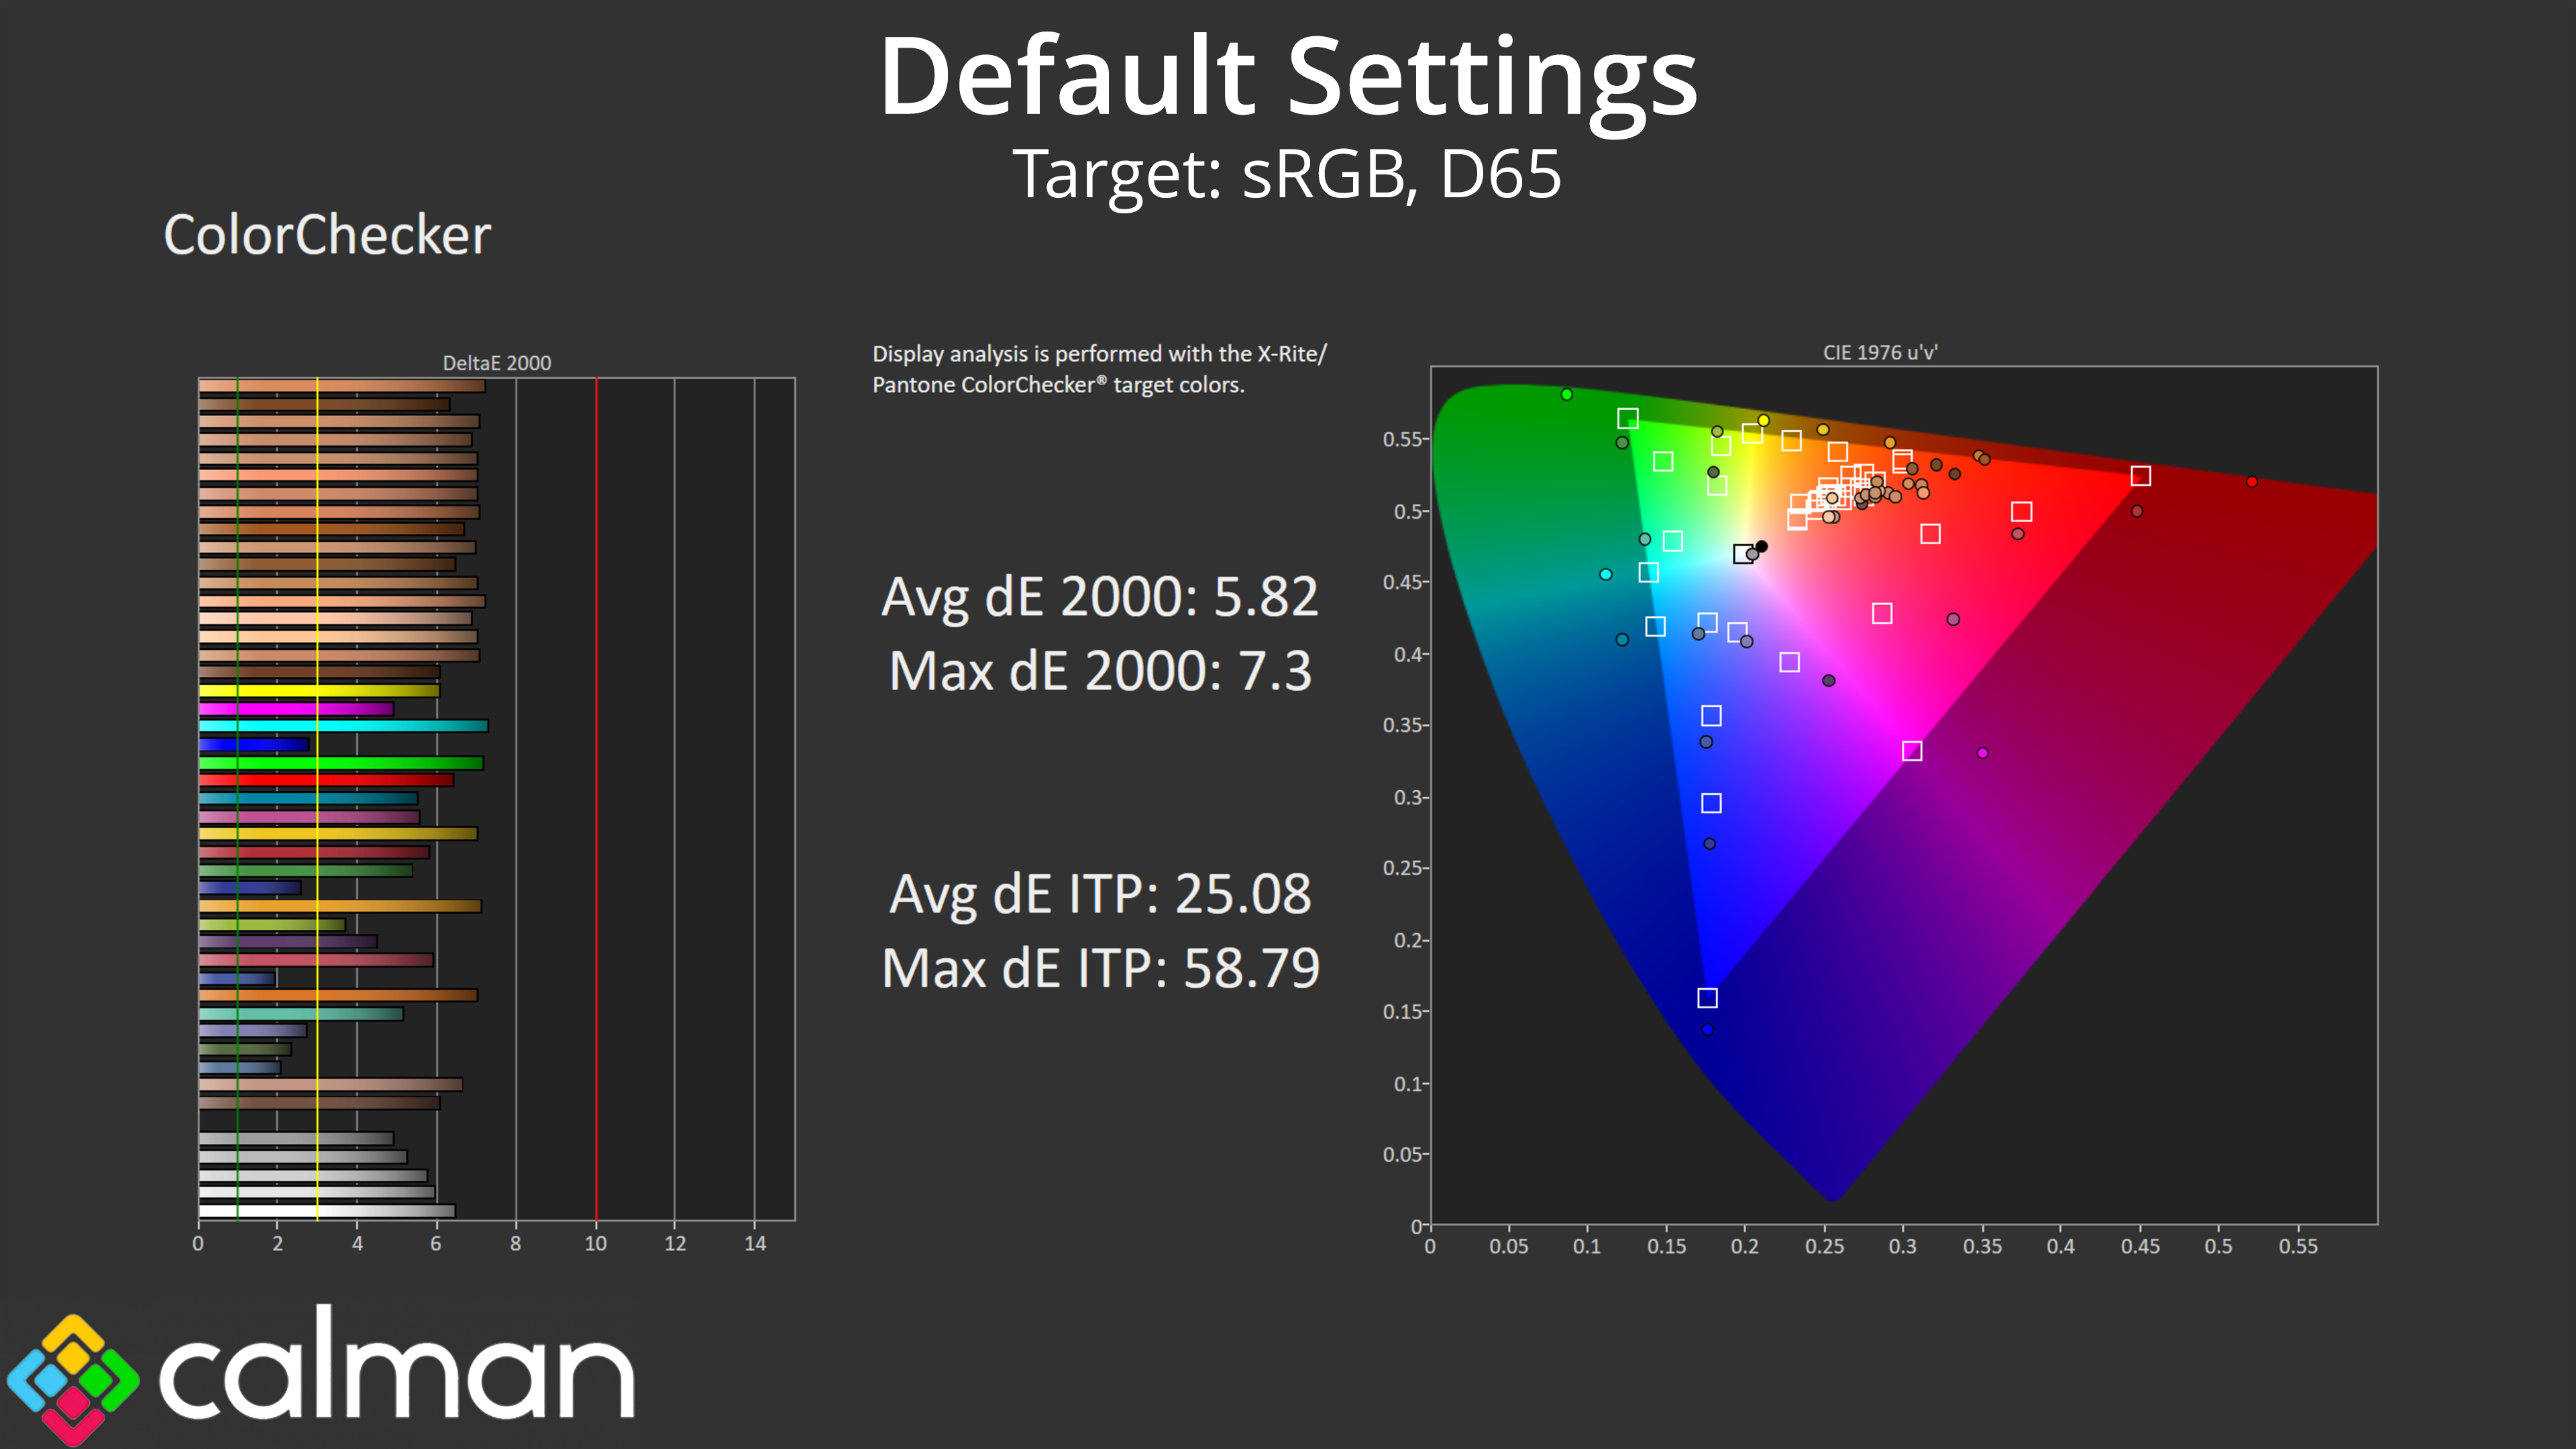
Colour accuracy isn't great when targeting the sRGB colour space due to the screen's gamut being much wider than sRGB, leading to the high levels of over-saturation we saw above. There is an sRGB emulation mode on offer from the 49M2C8900 which we test below.
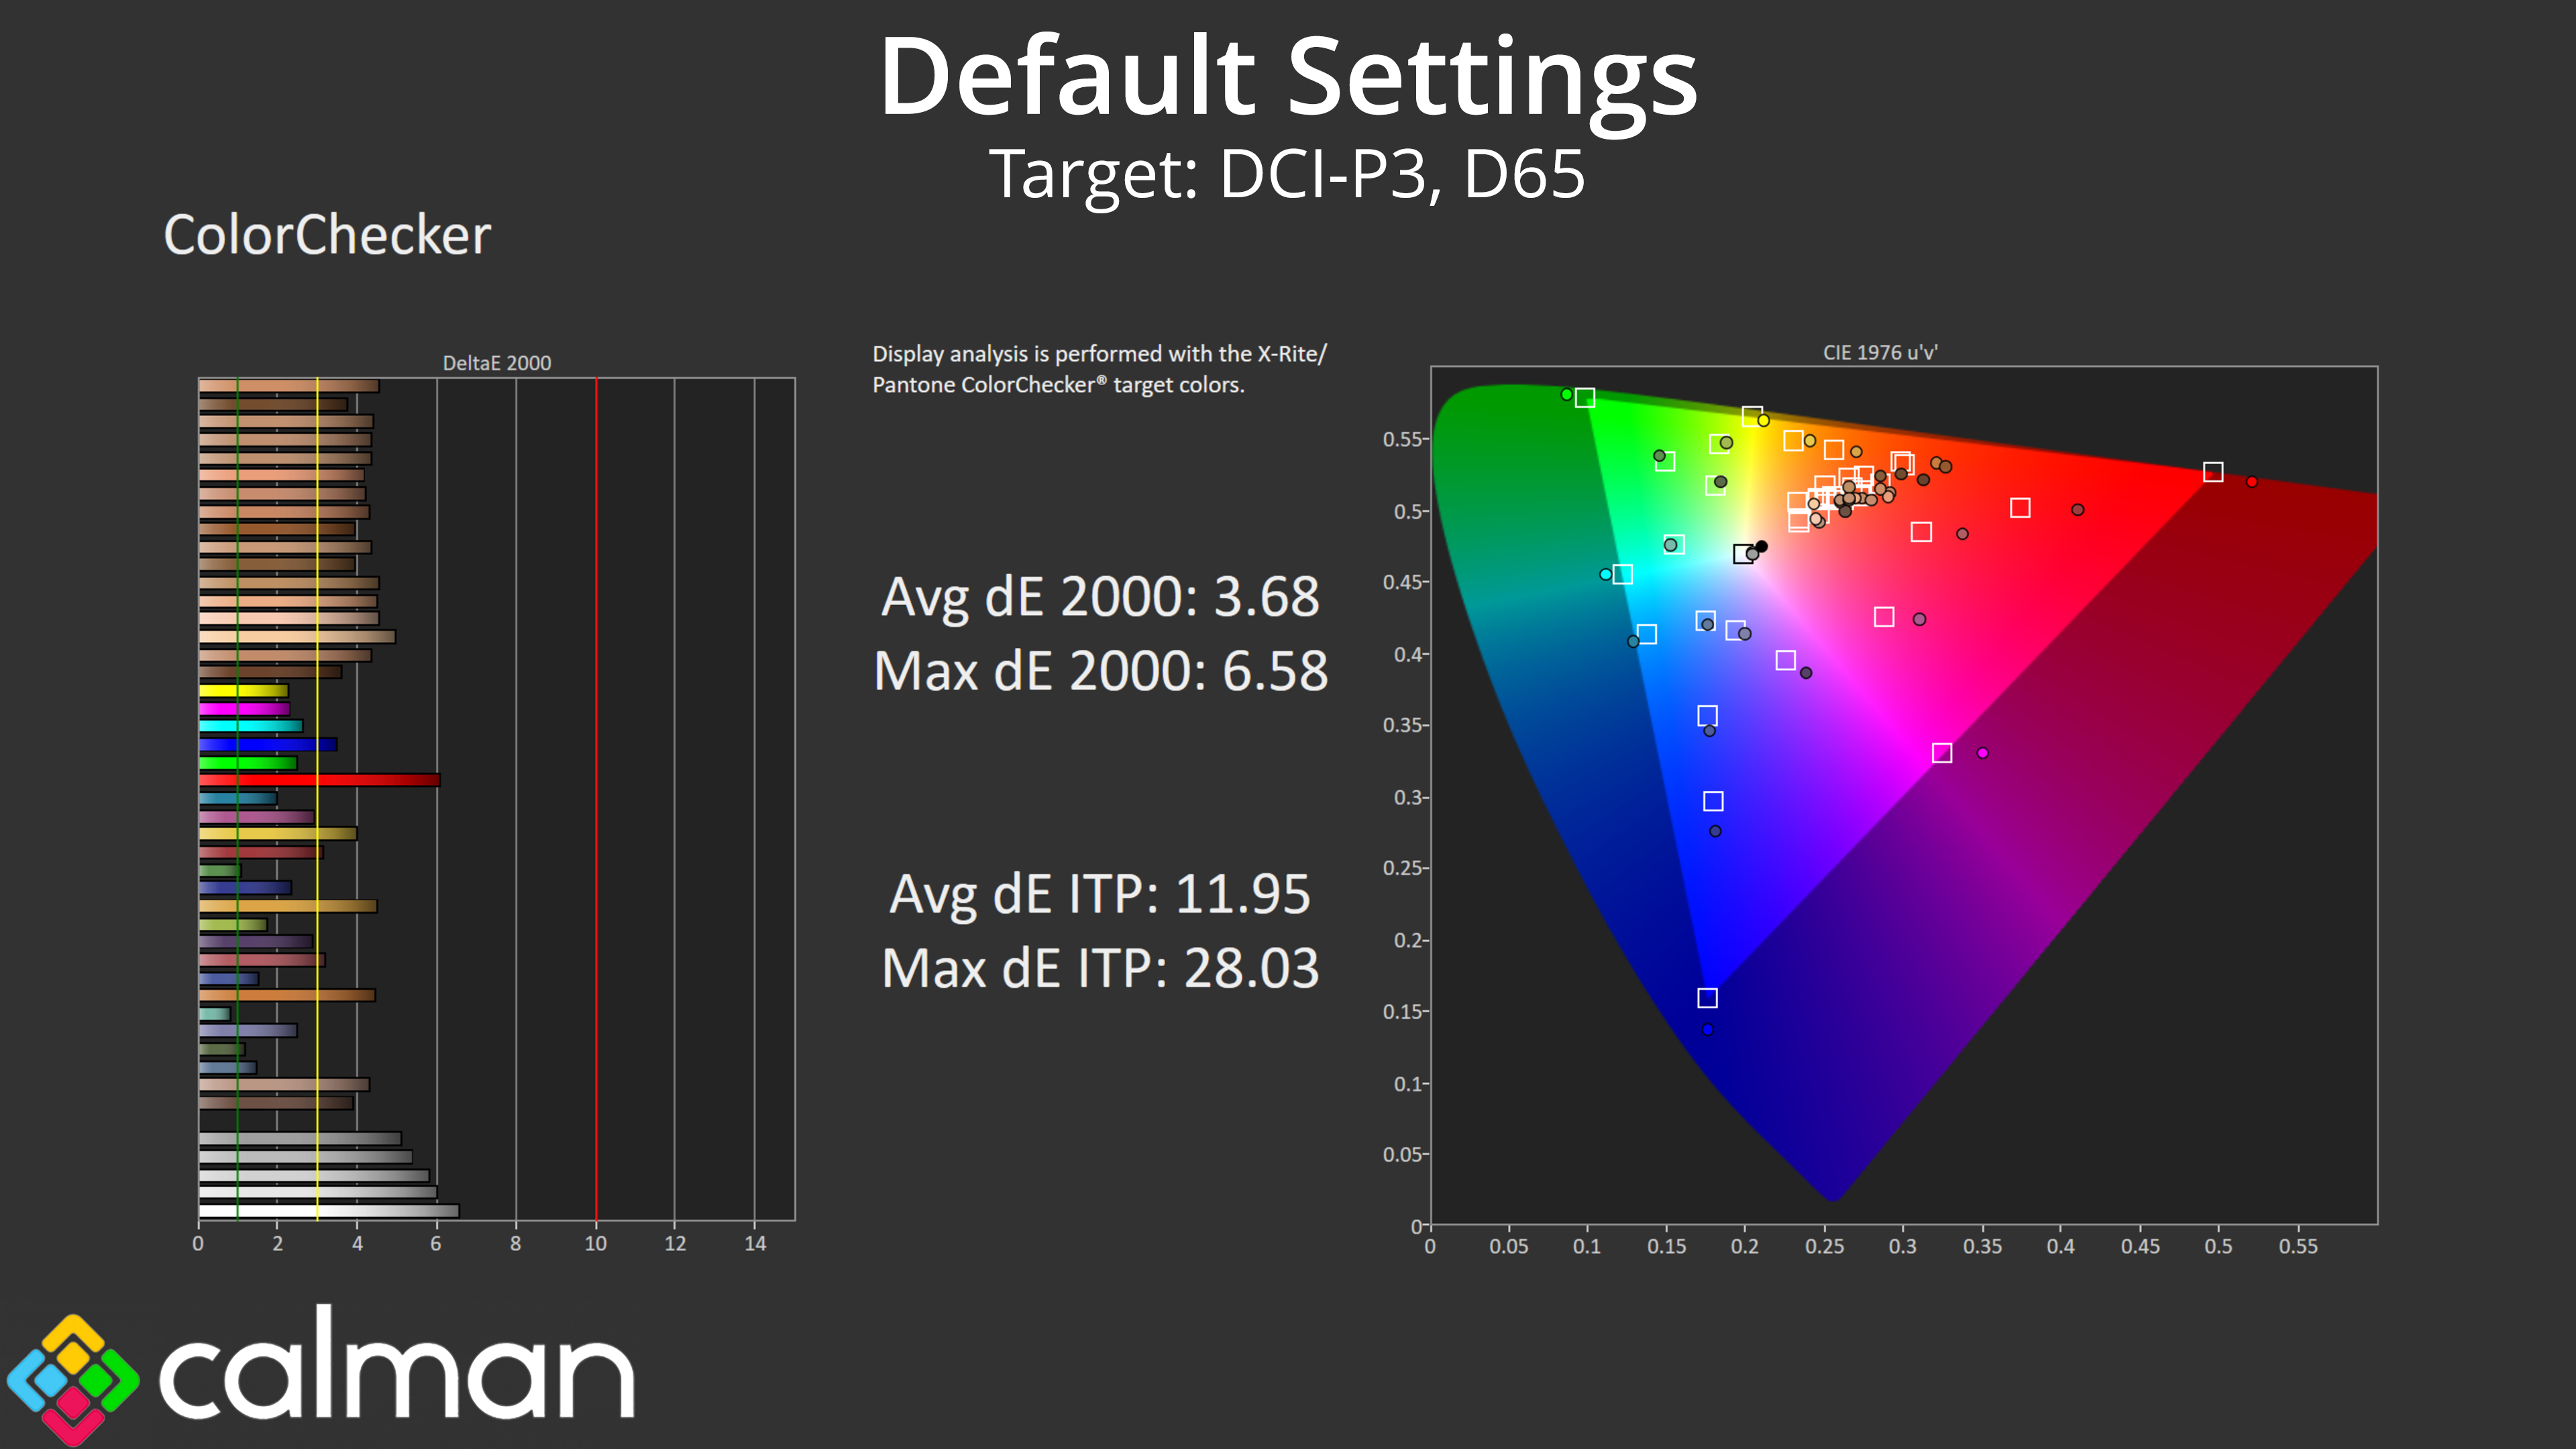
When targeting the DCI-P3 space, colour accuracy does look better, but still isn't perfect – particularly when looking at lighter shades and skin tones.
sRGB Emulation Mode
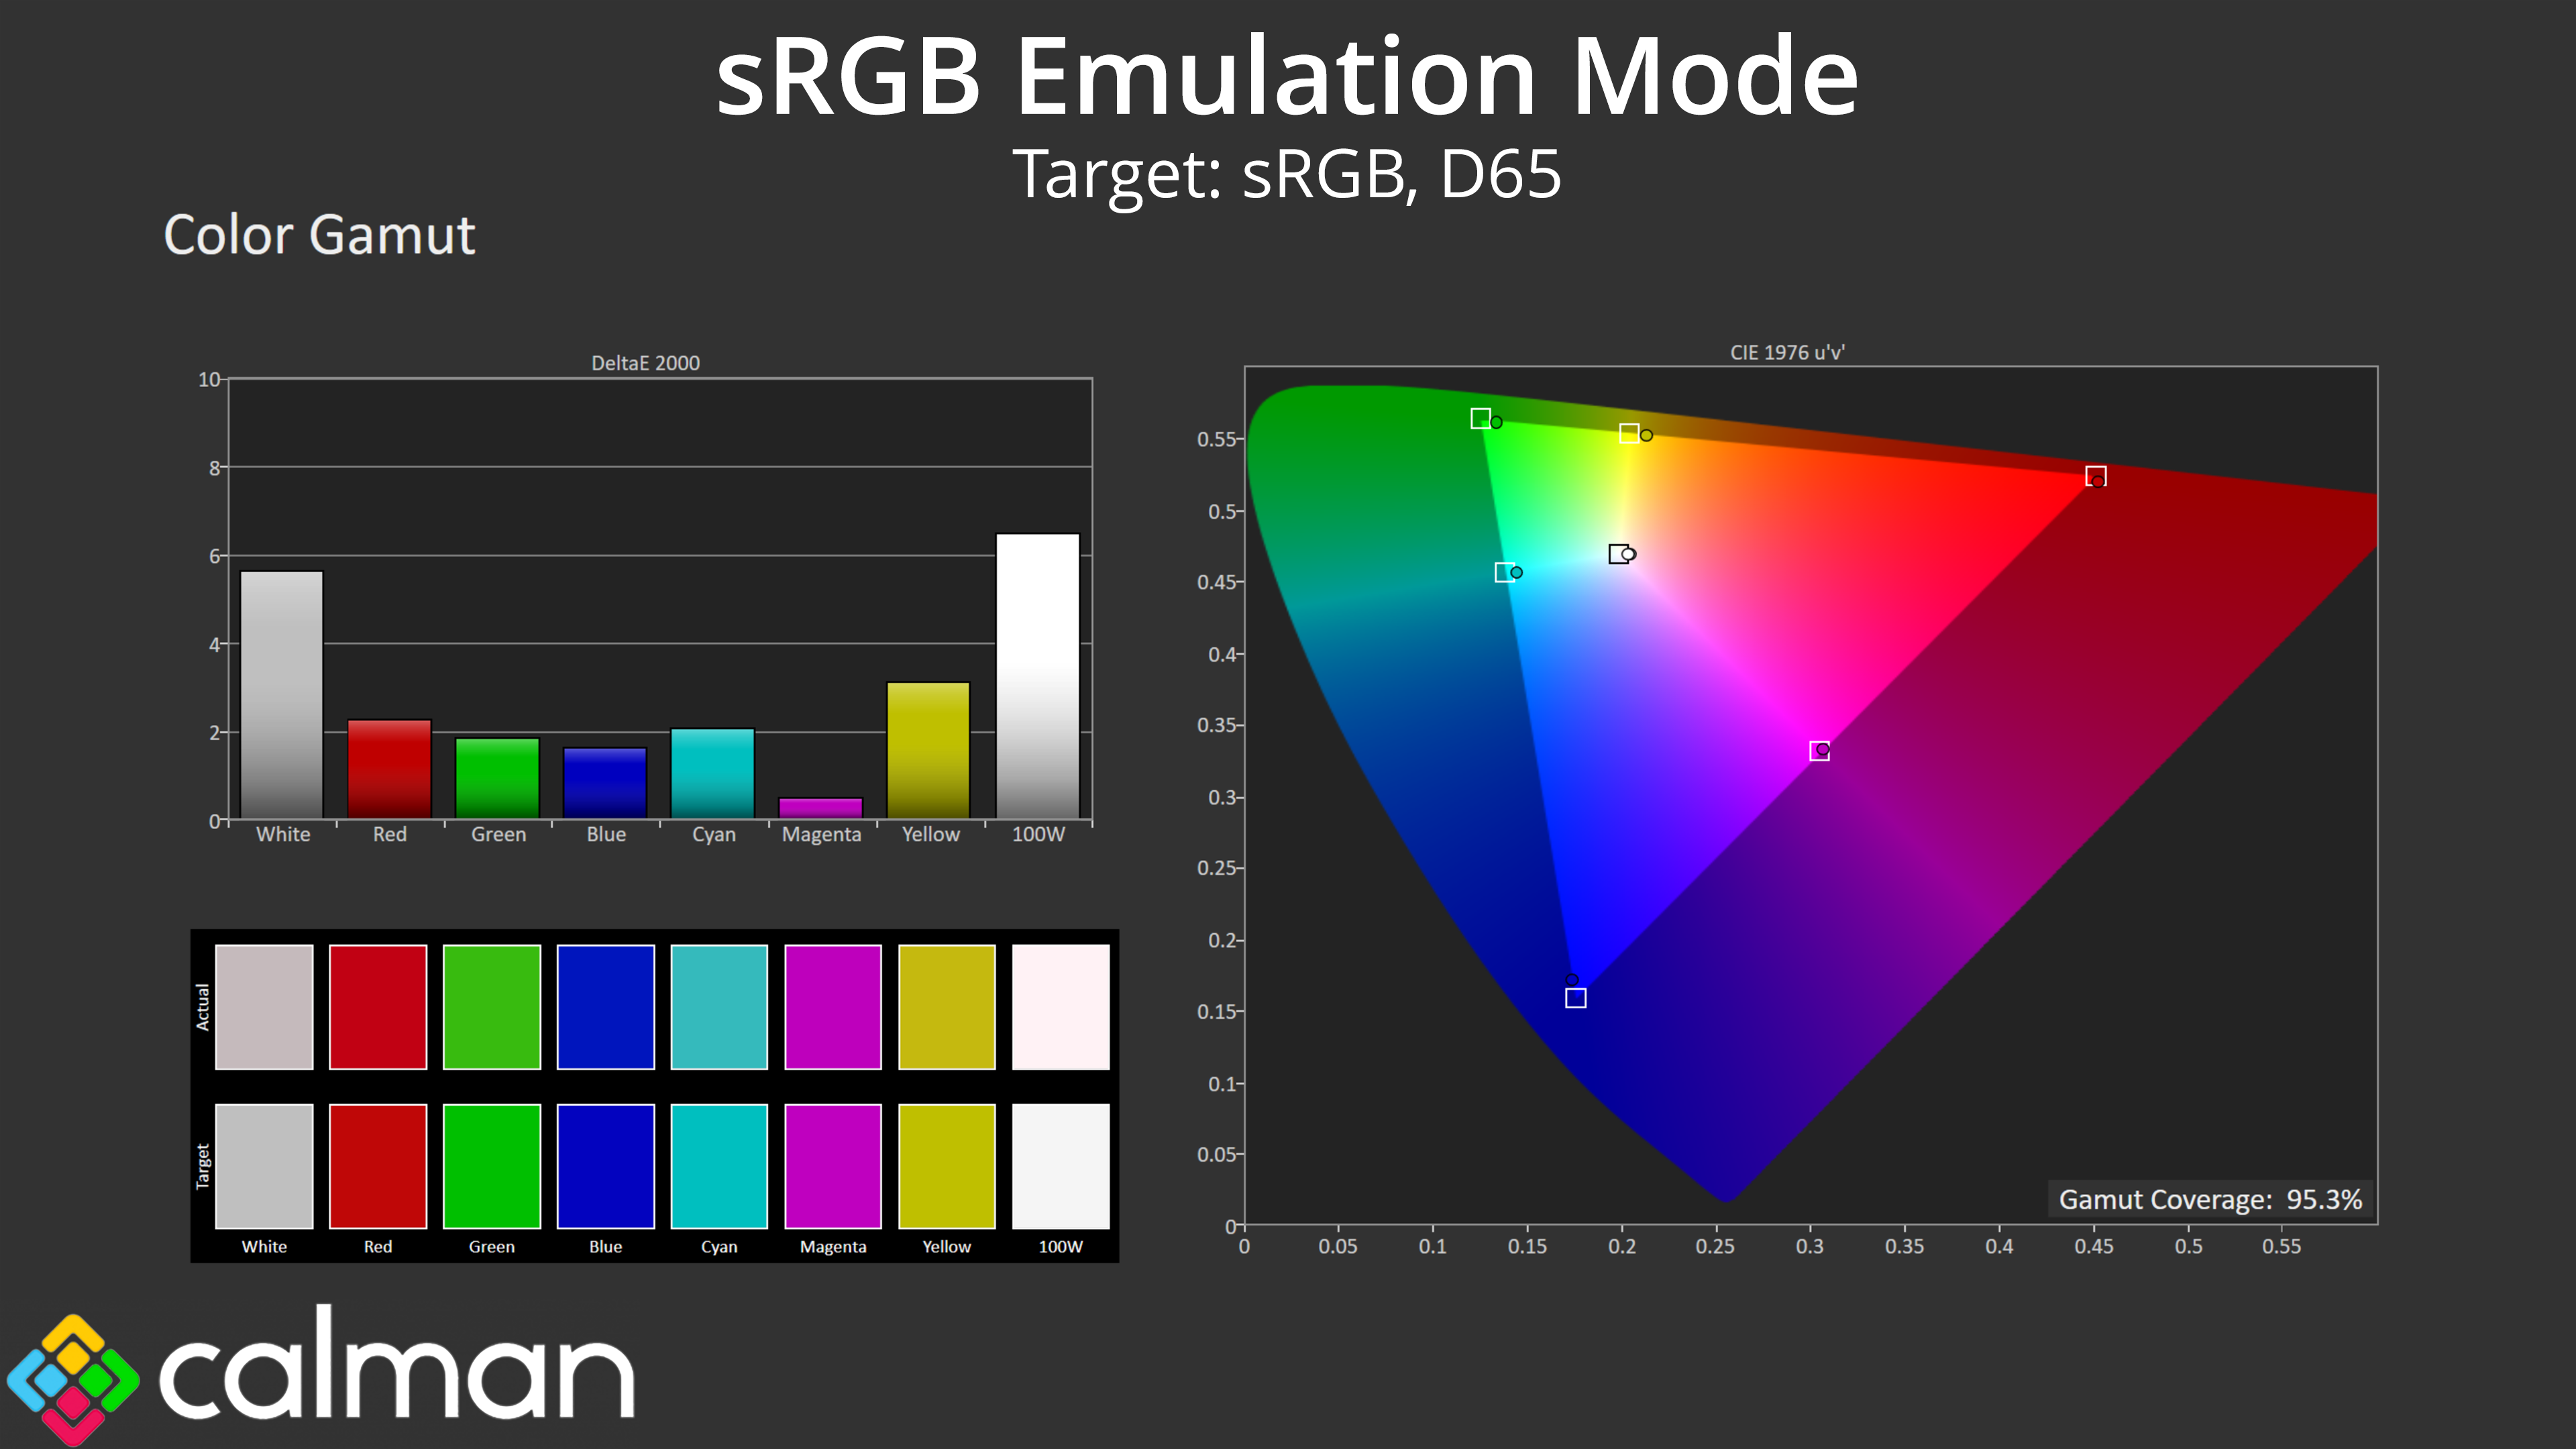
Unfortunately, the sRGB emulation mode isn't wonderful, it actually clamped the colour space too much, with sRGB coverage reporting at 95.3%.
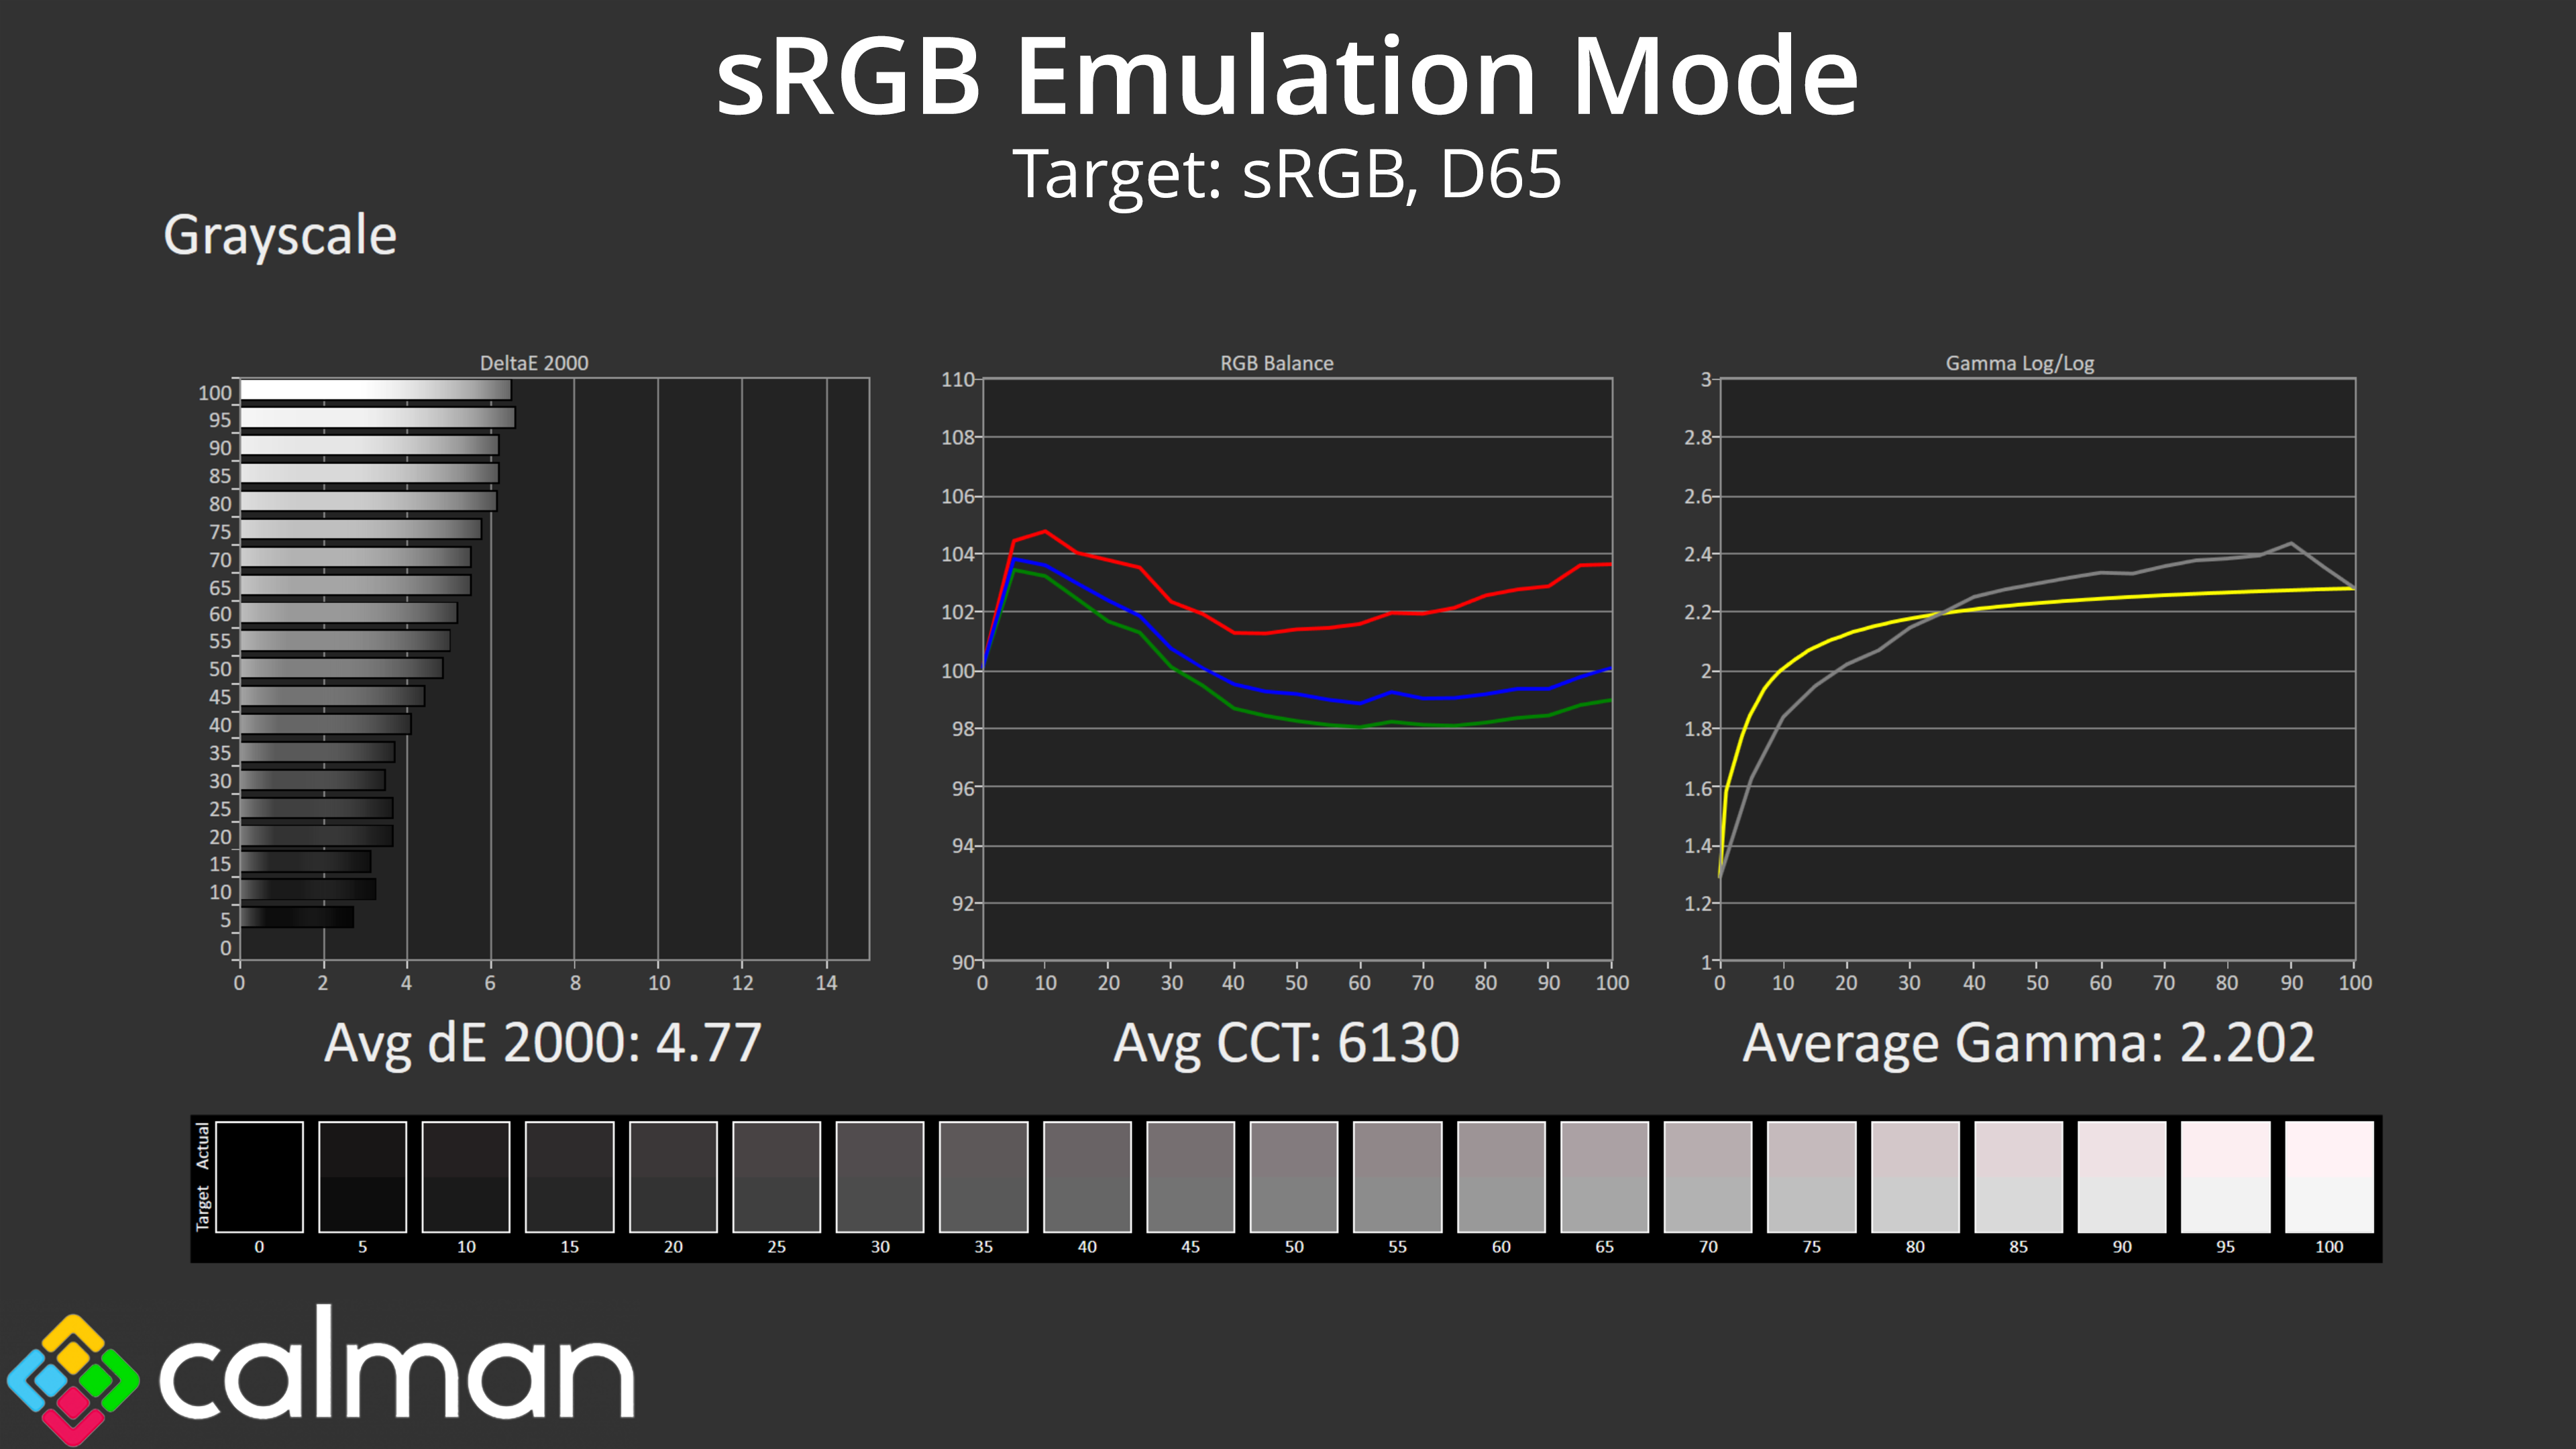
The colour balance is still too warm, and the gamma curve is slightly less accurate than what we saw previously, being slightly too bright for the darker shades, but then slightly too dark for the brighter shades.
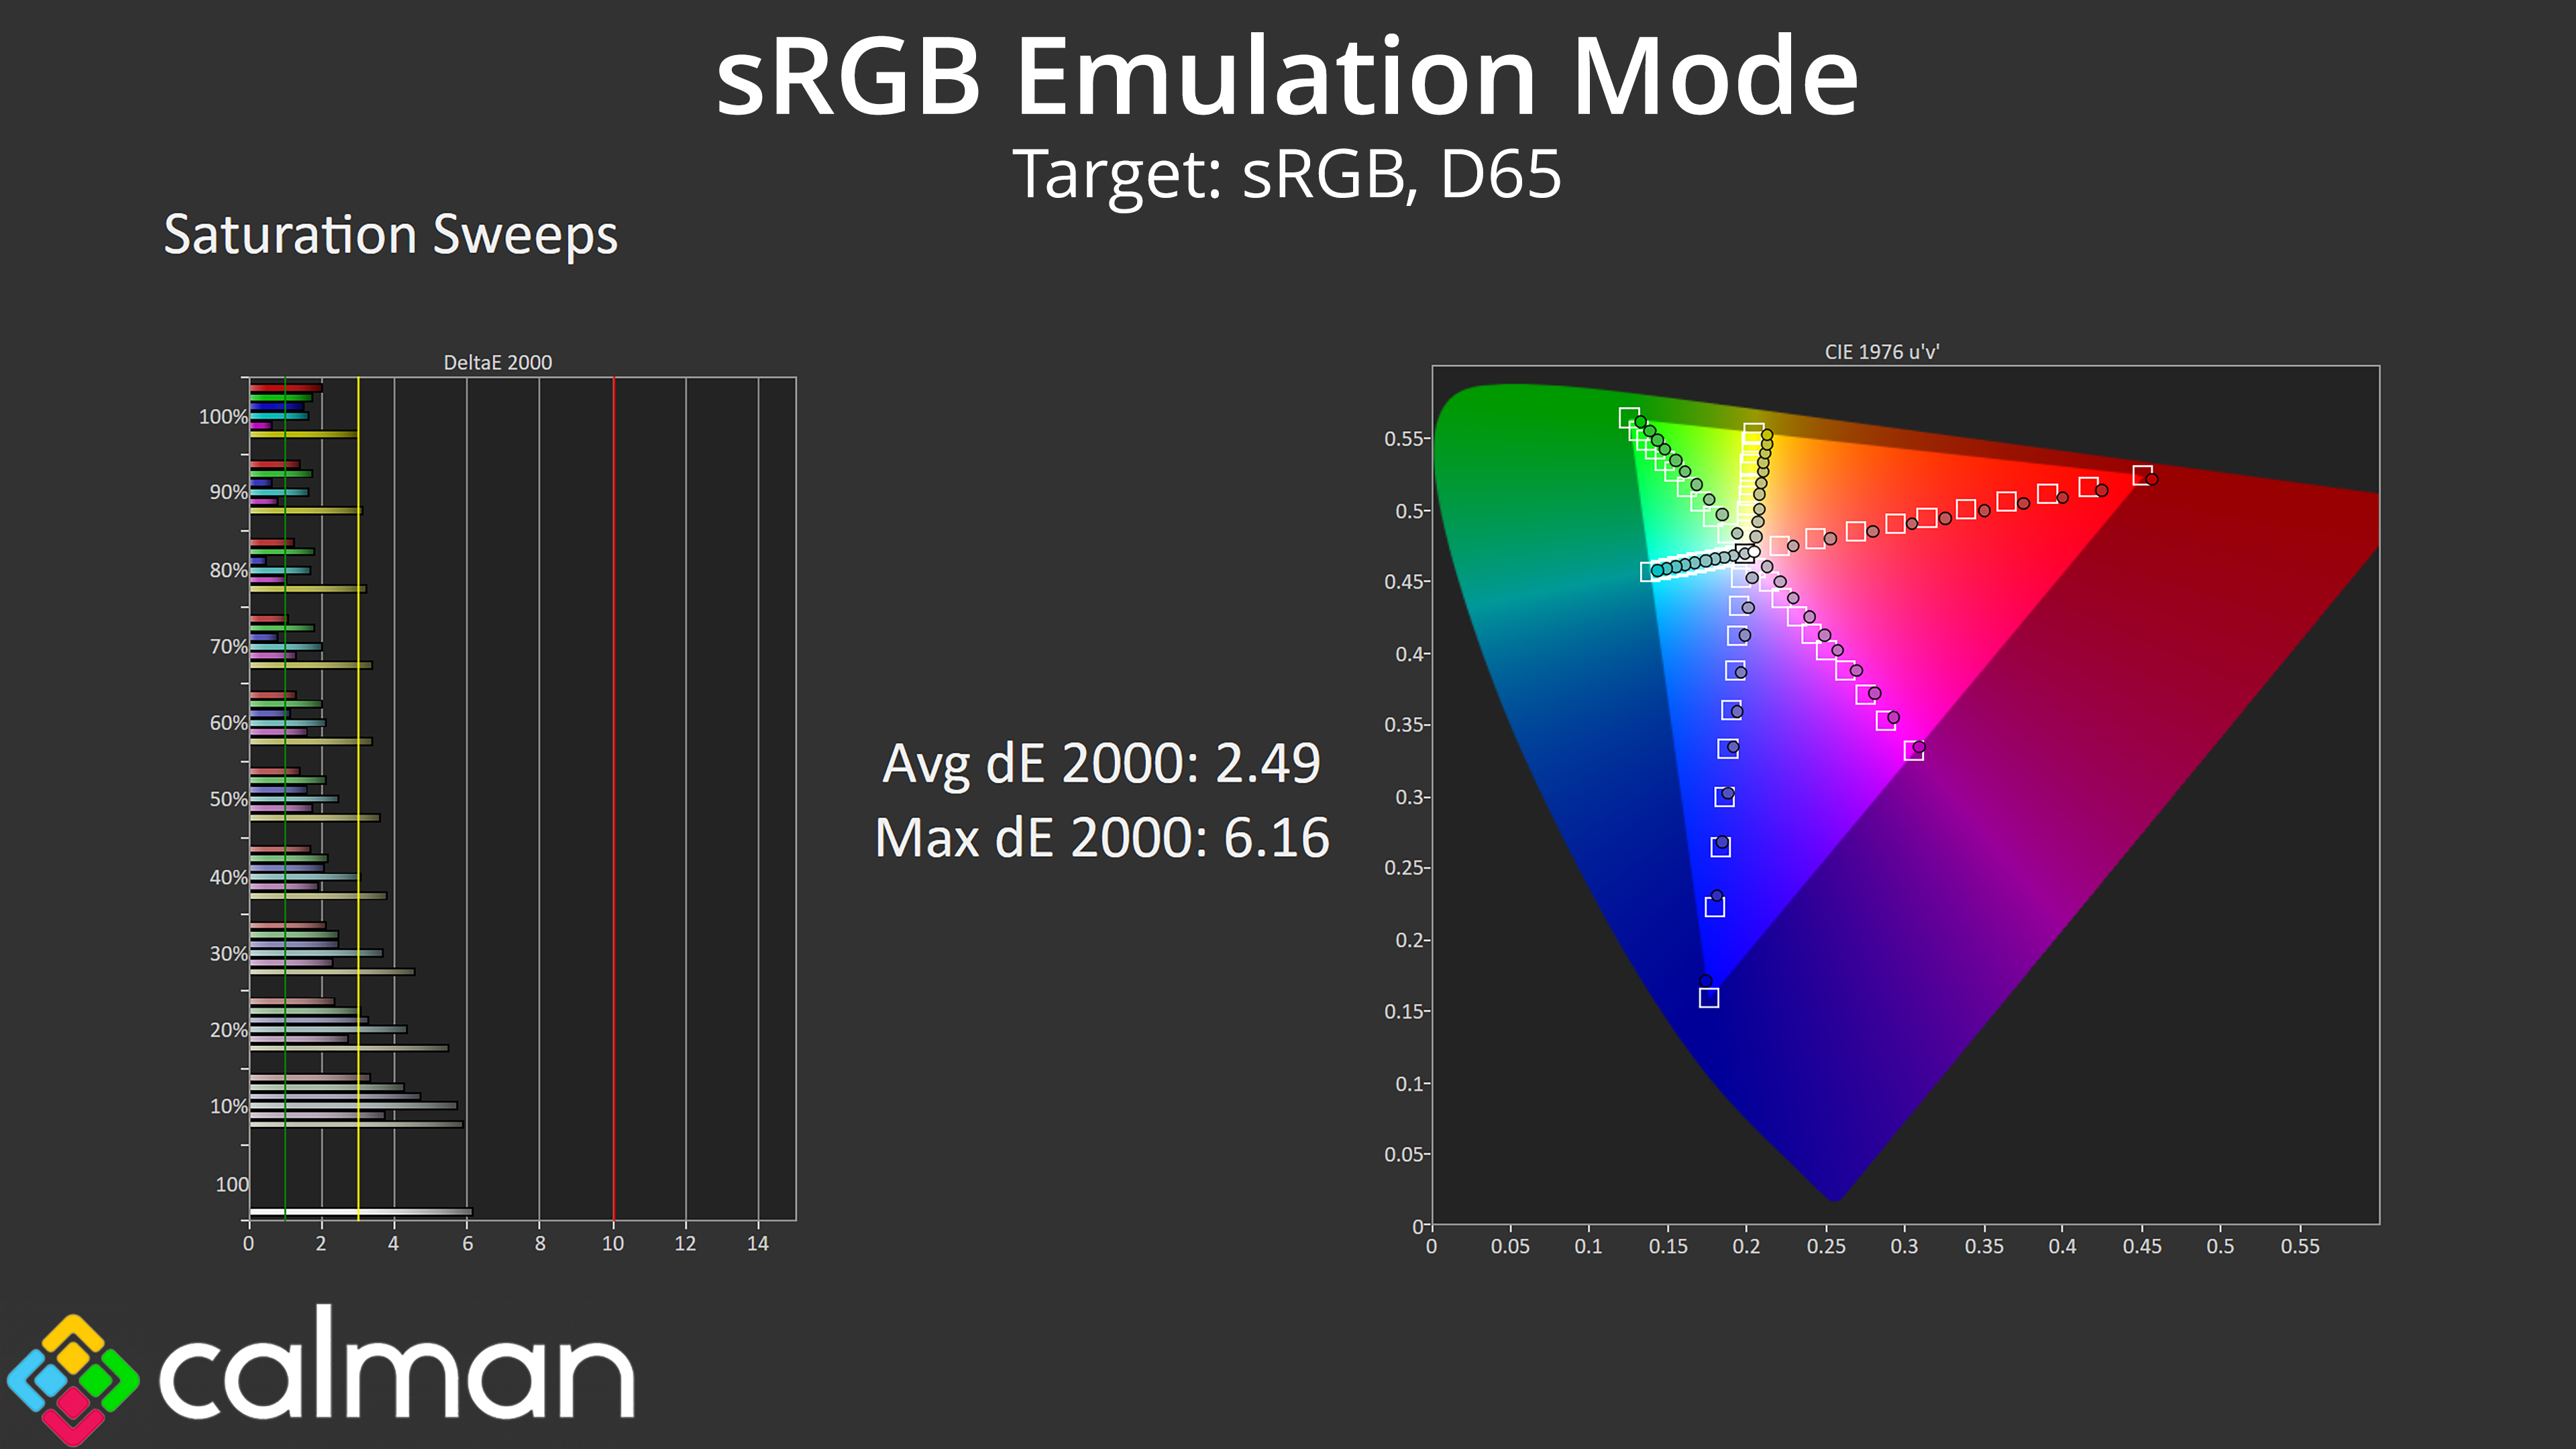
Saturation is definitely better than what we saw using the default (non-sRGB mode) settings, but it's not quite as accurate as I'd hope, particularly when looking at yellow shades.
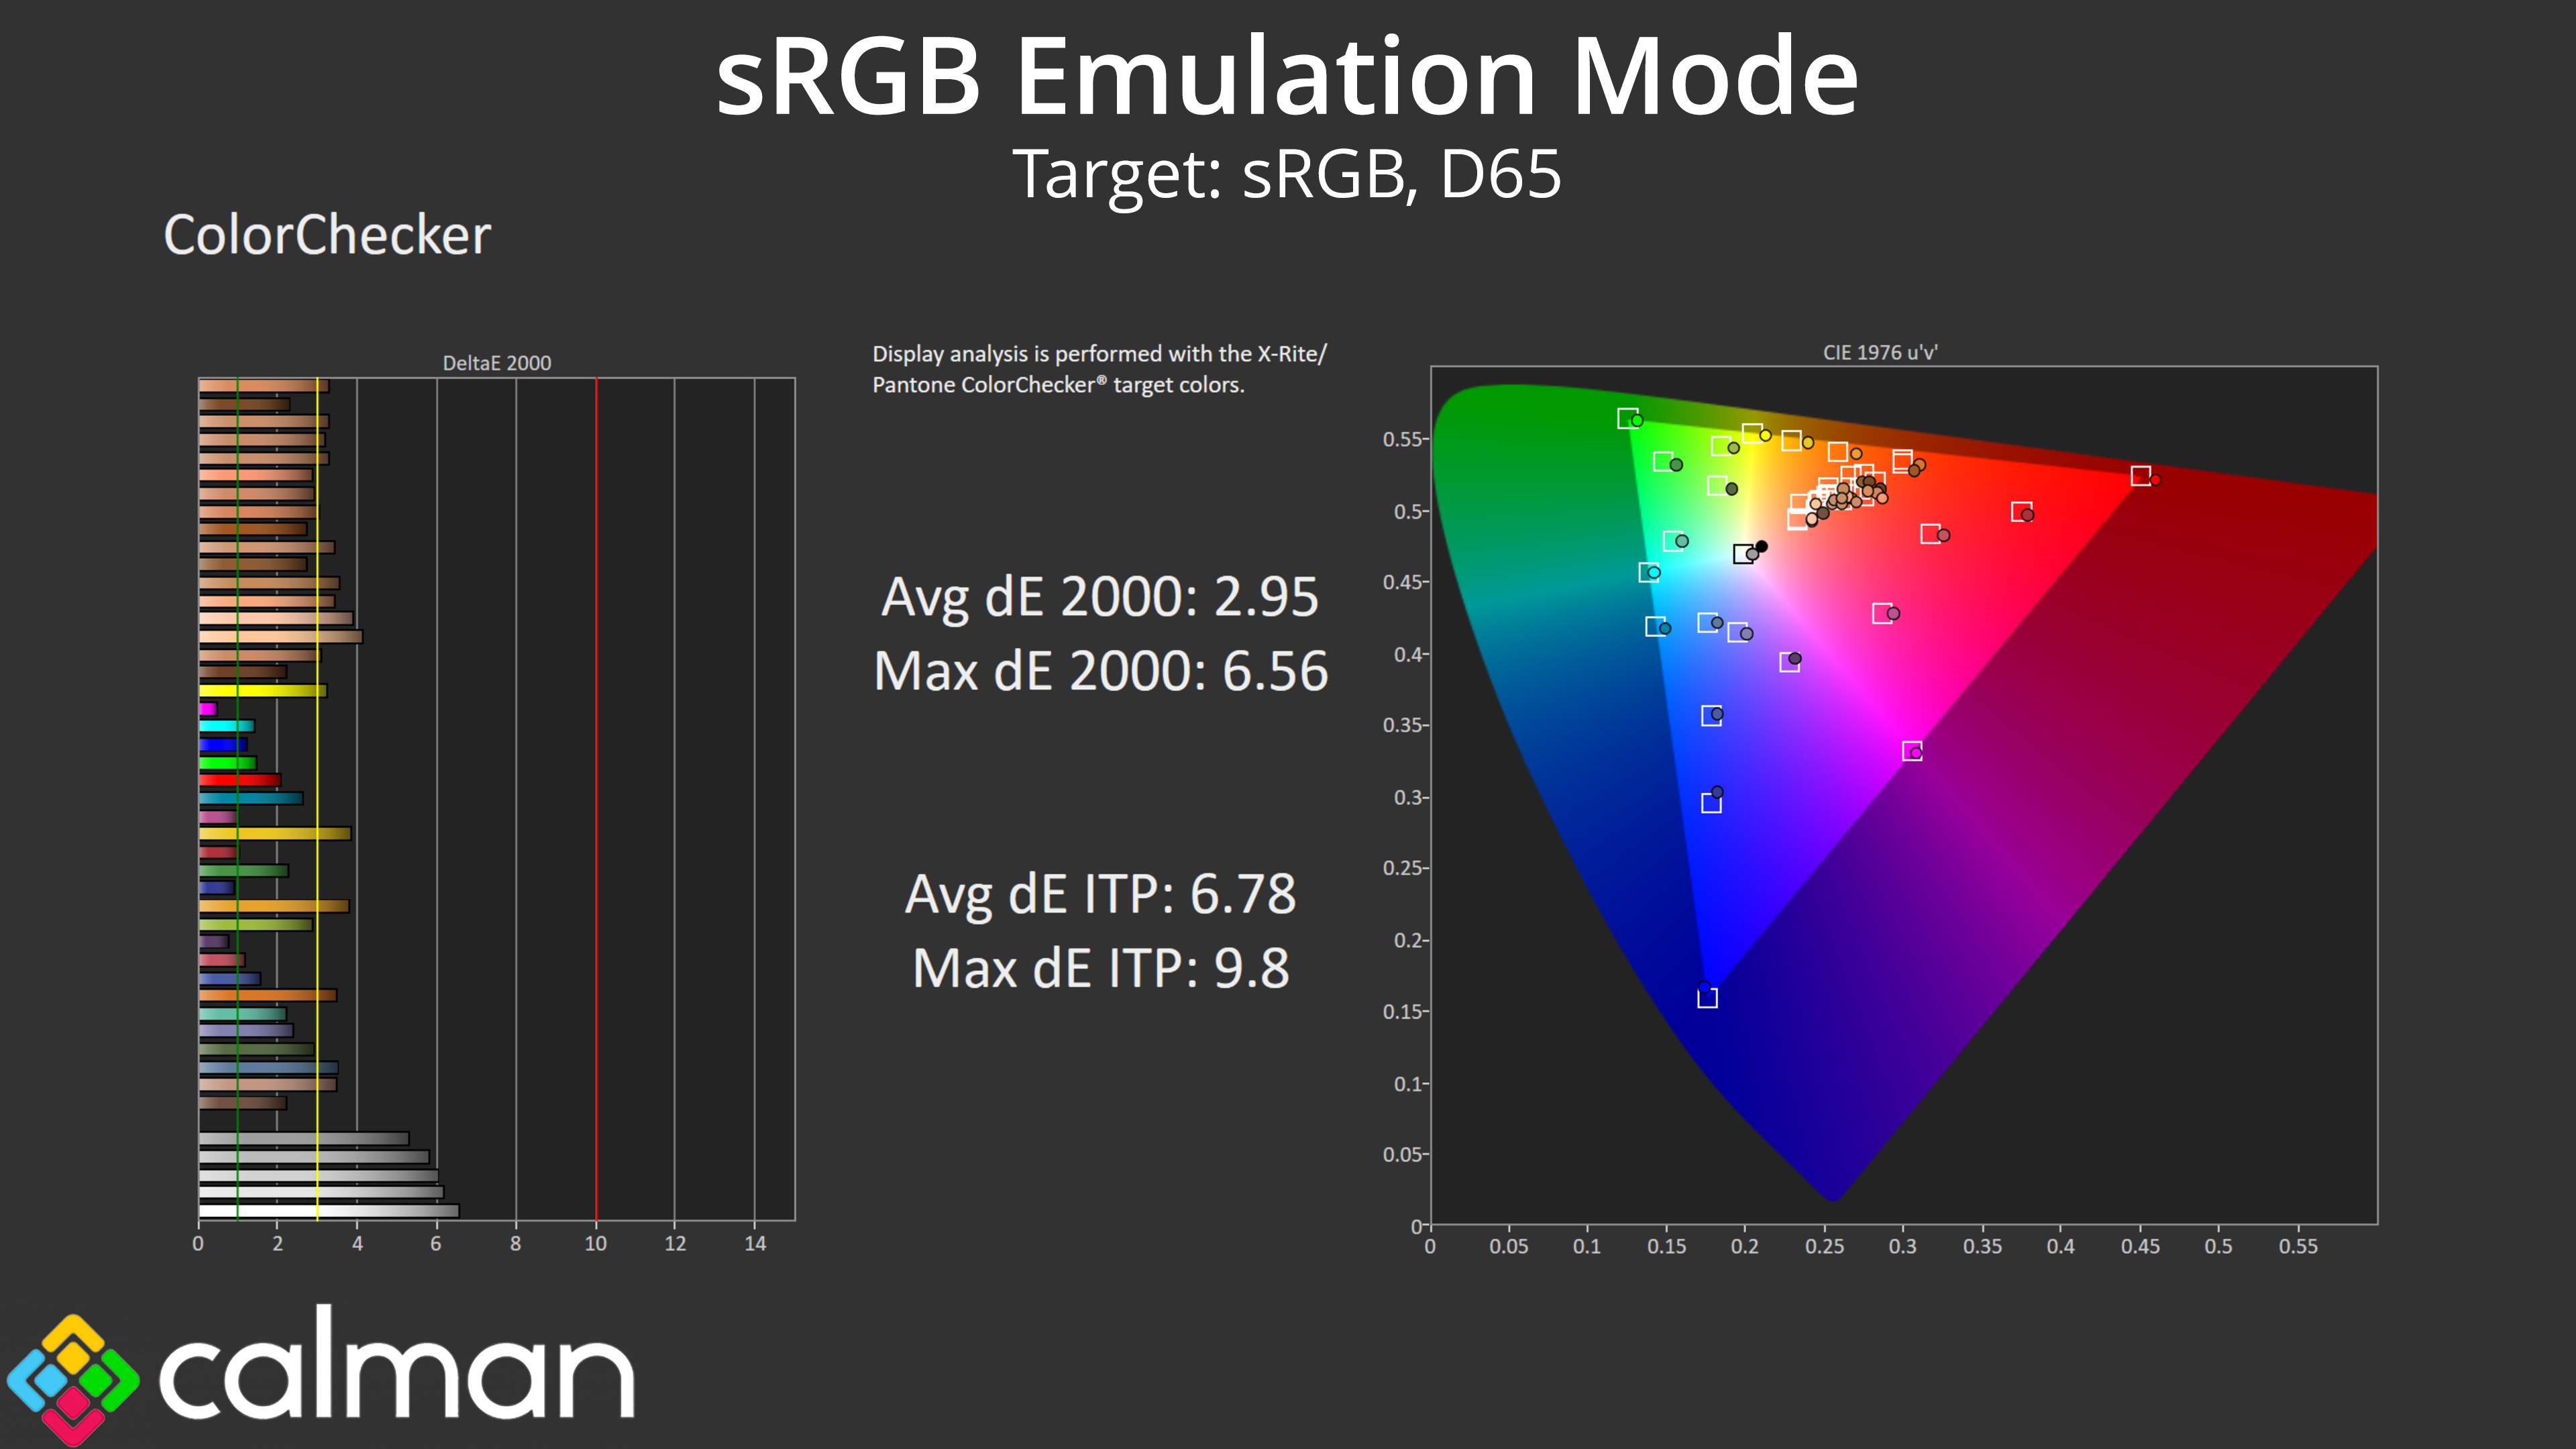
Overall, colour accuracy does improve using the sRGB emulation mode, but it's still not wonderful with an average dE 2000 of 2.95. That leaves full calibration as the only real solution for delivering more accurate sRGB colours with the 49M2C8900.
Calibrated results
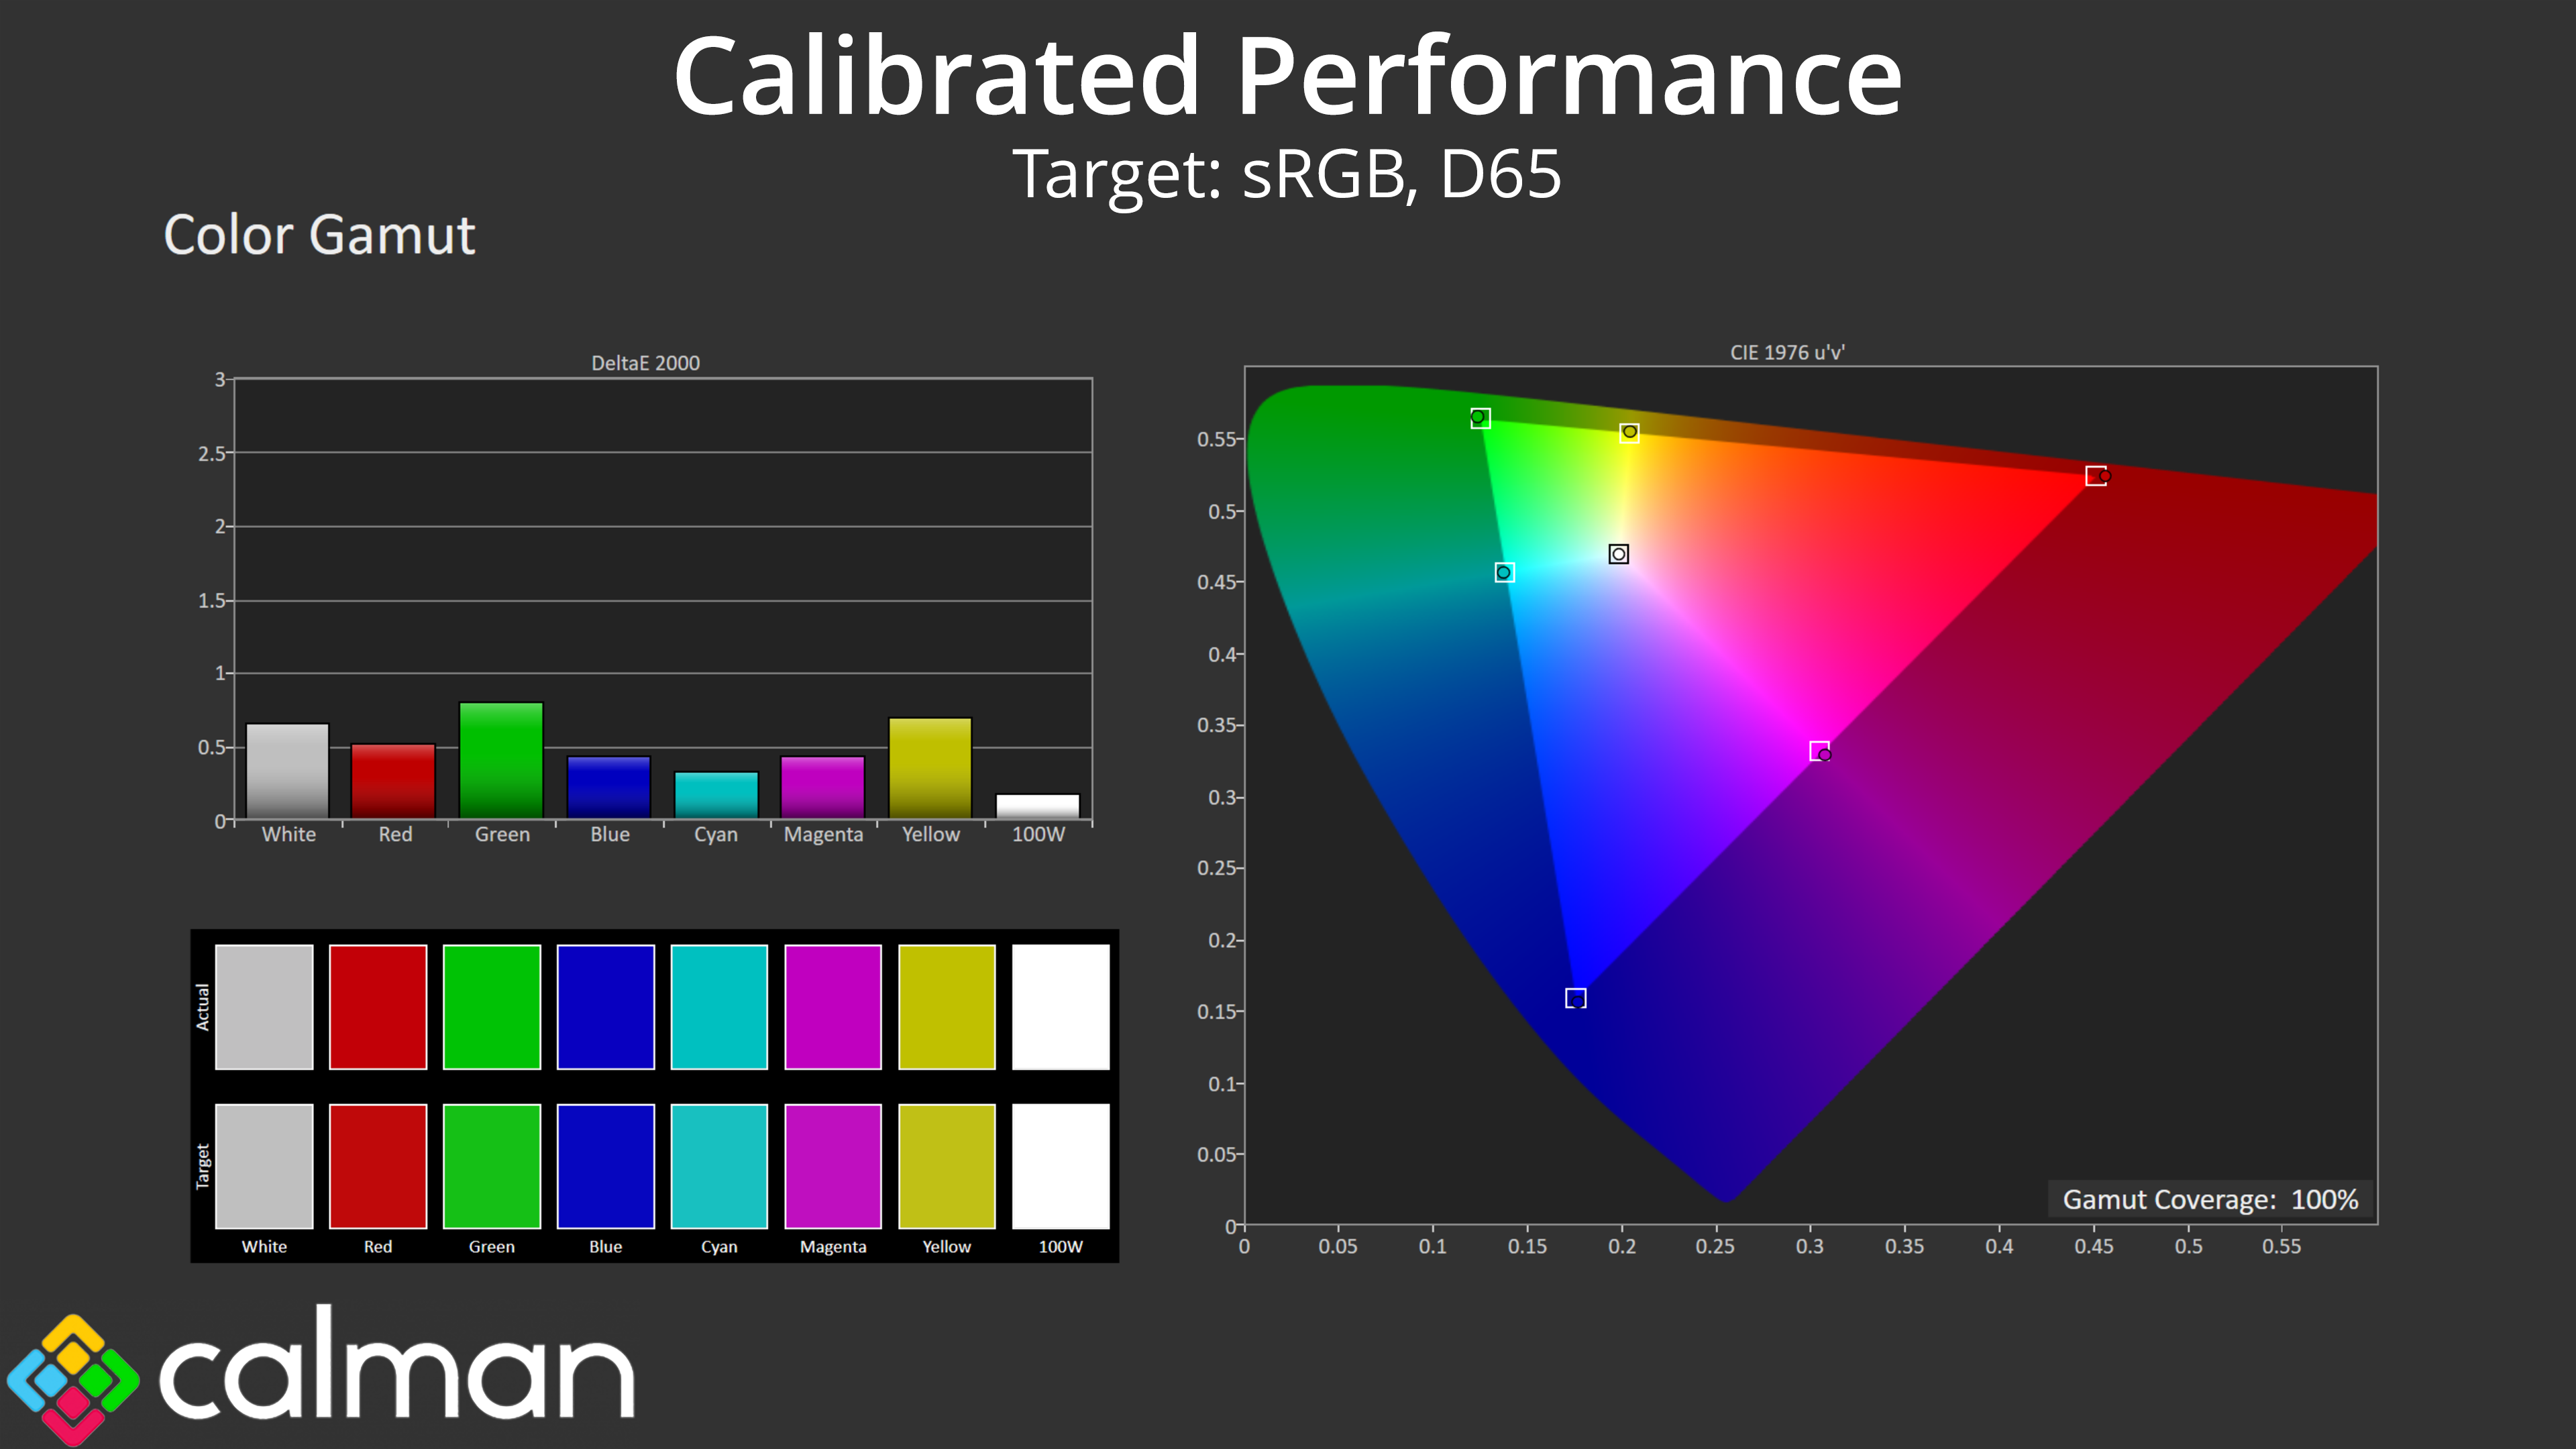
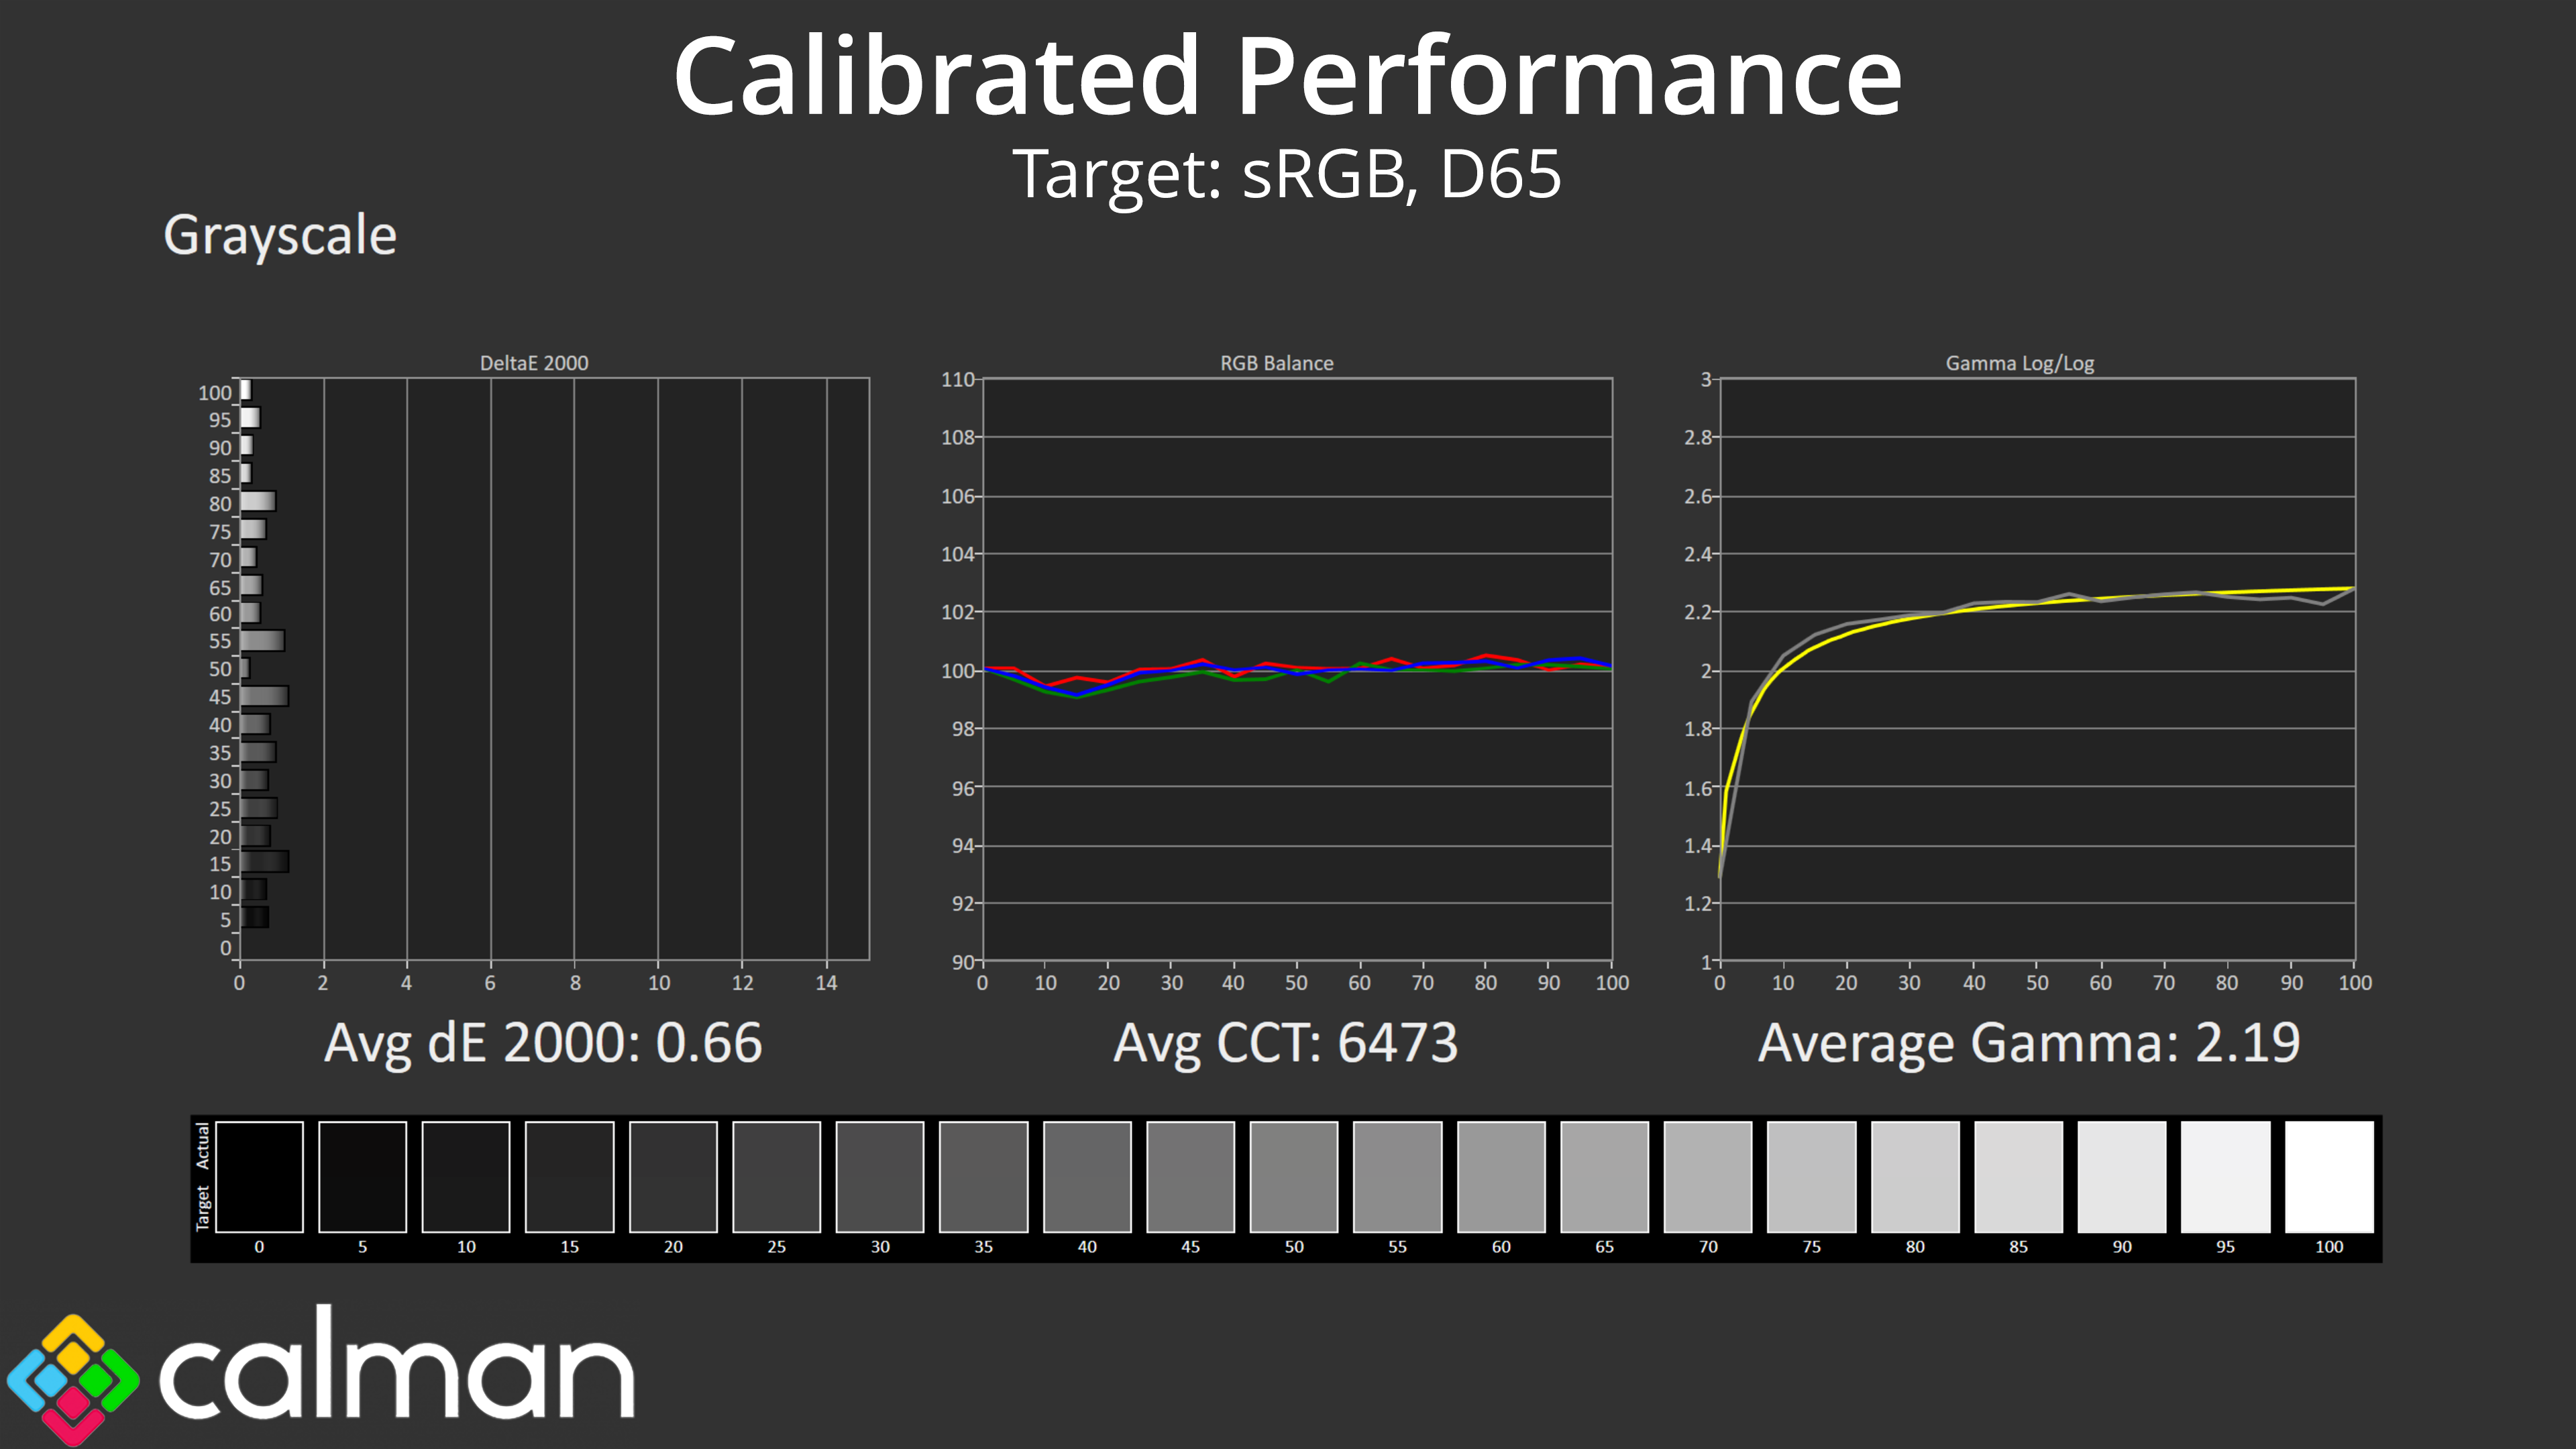
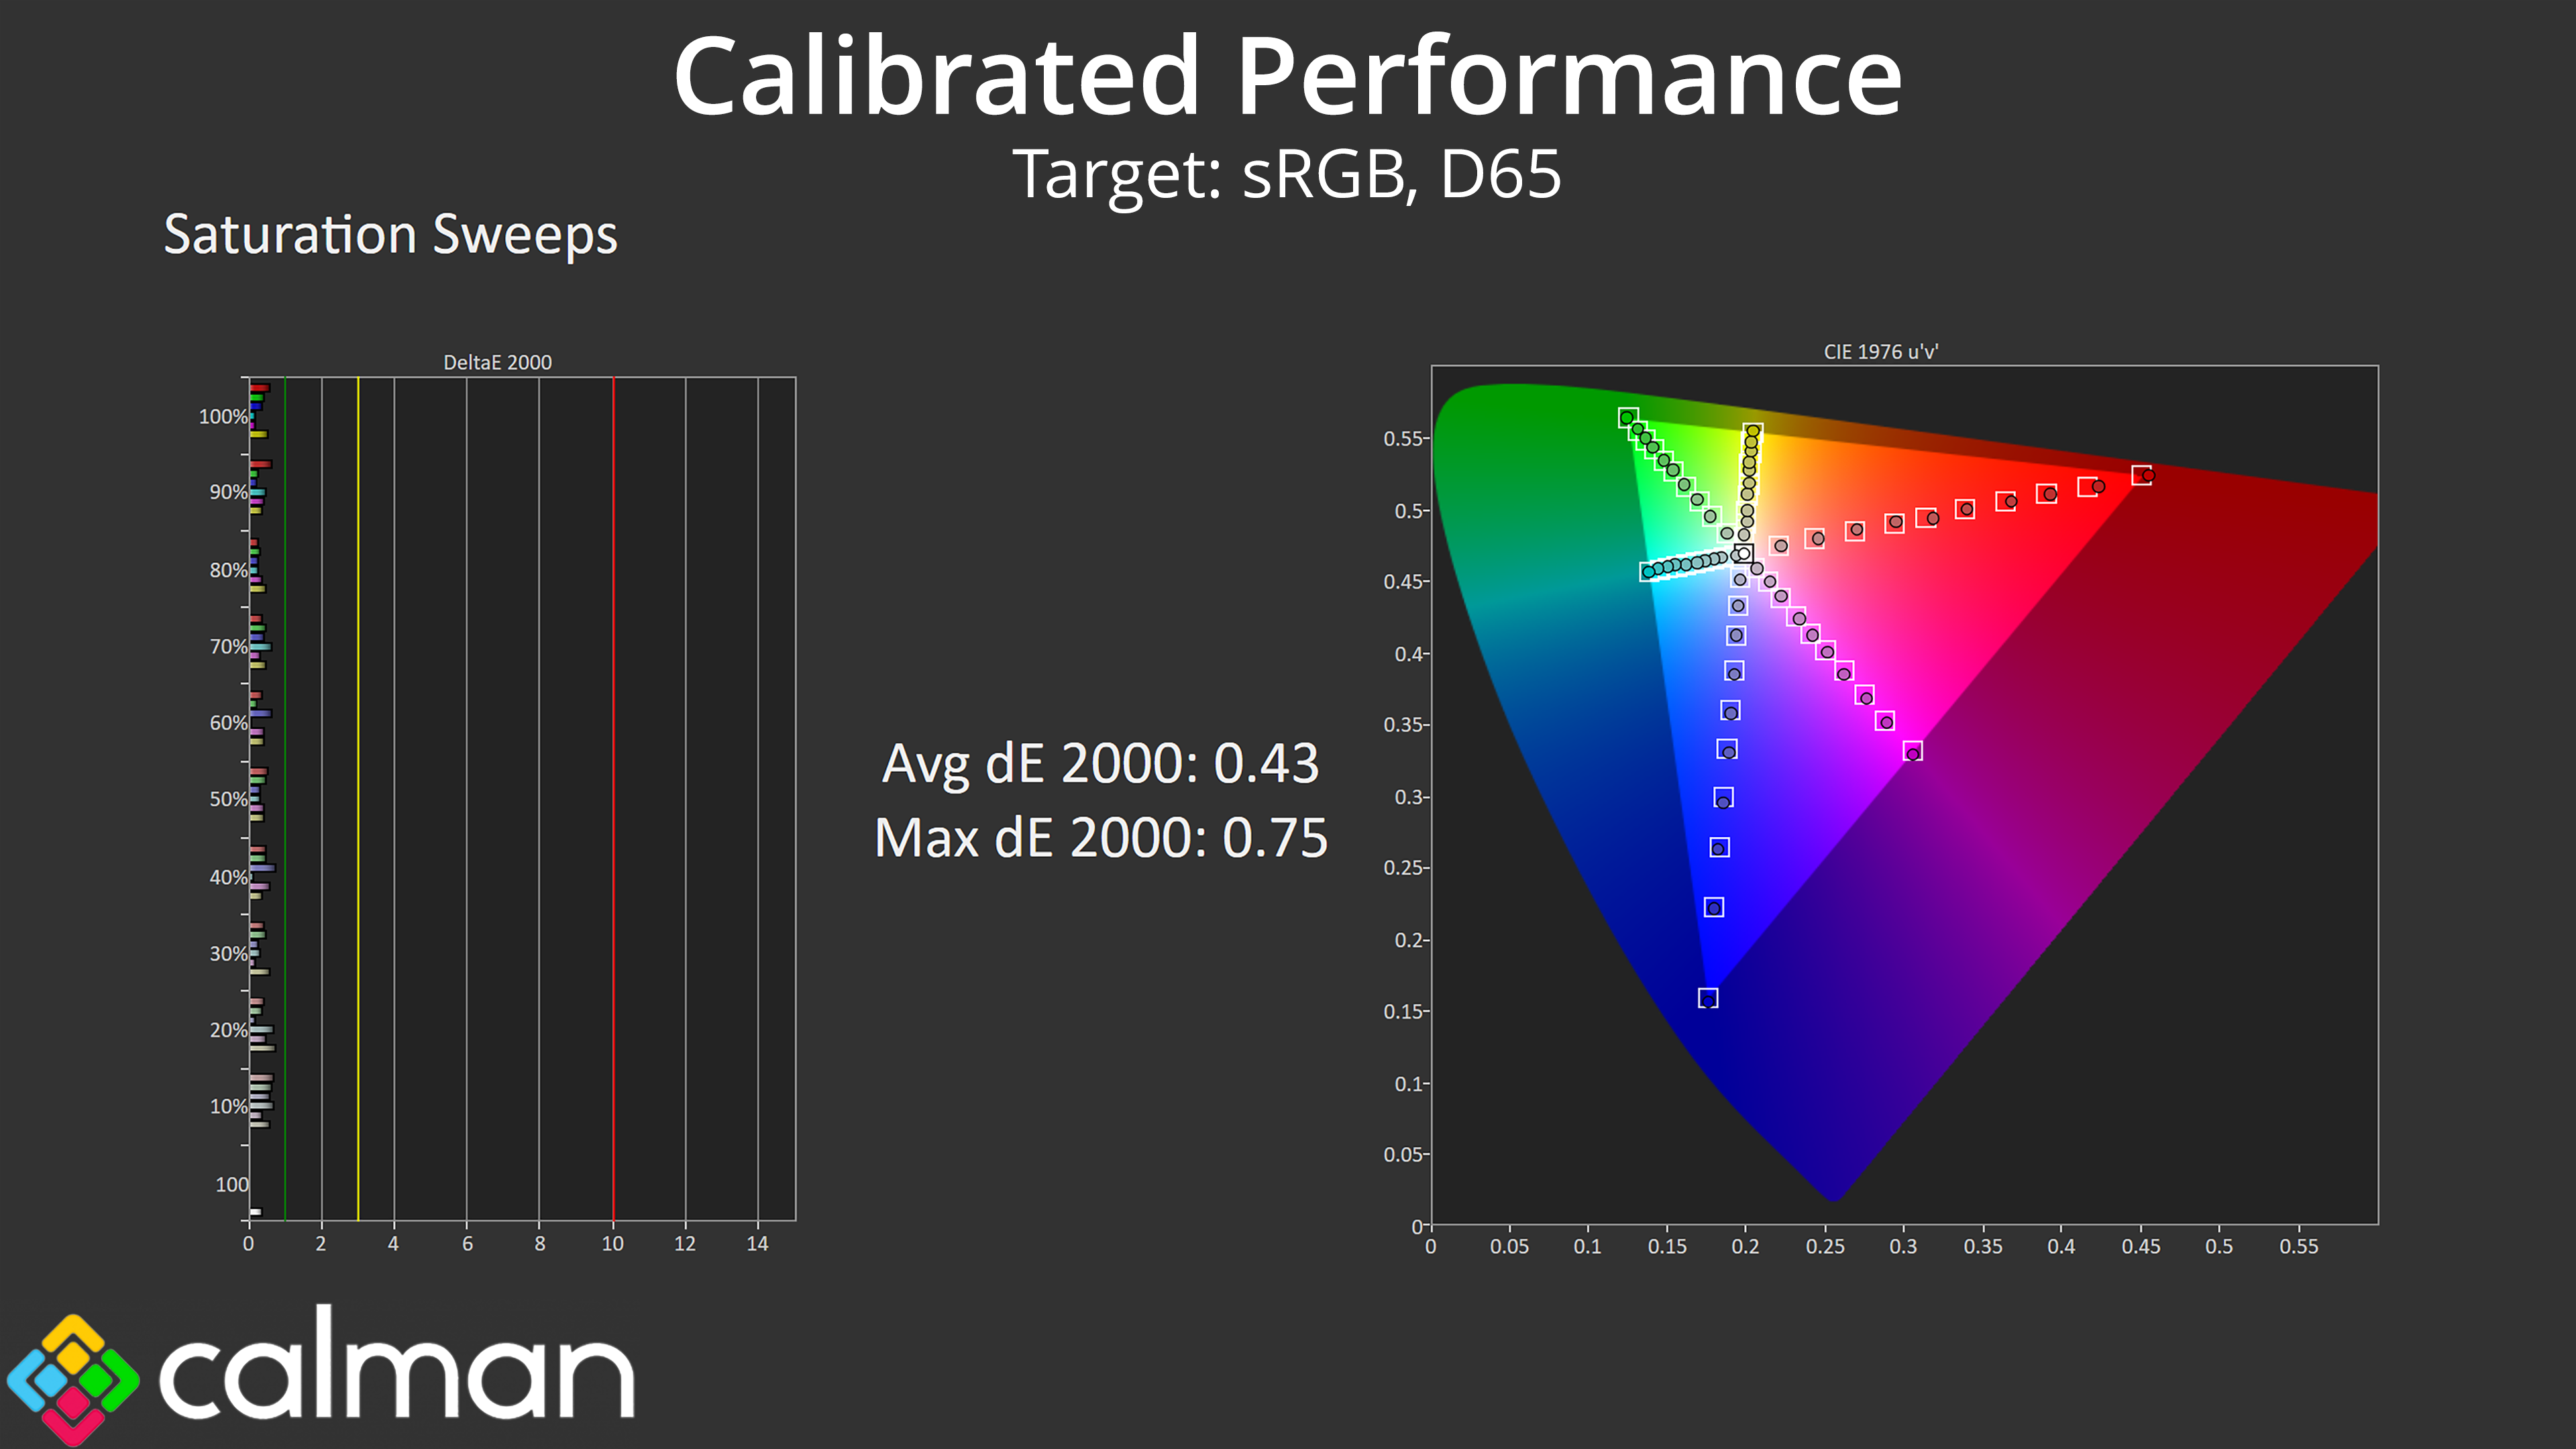
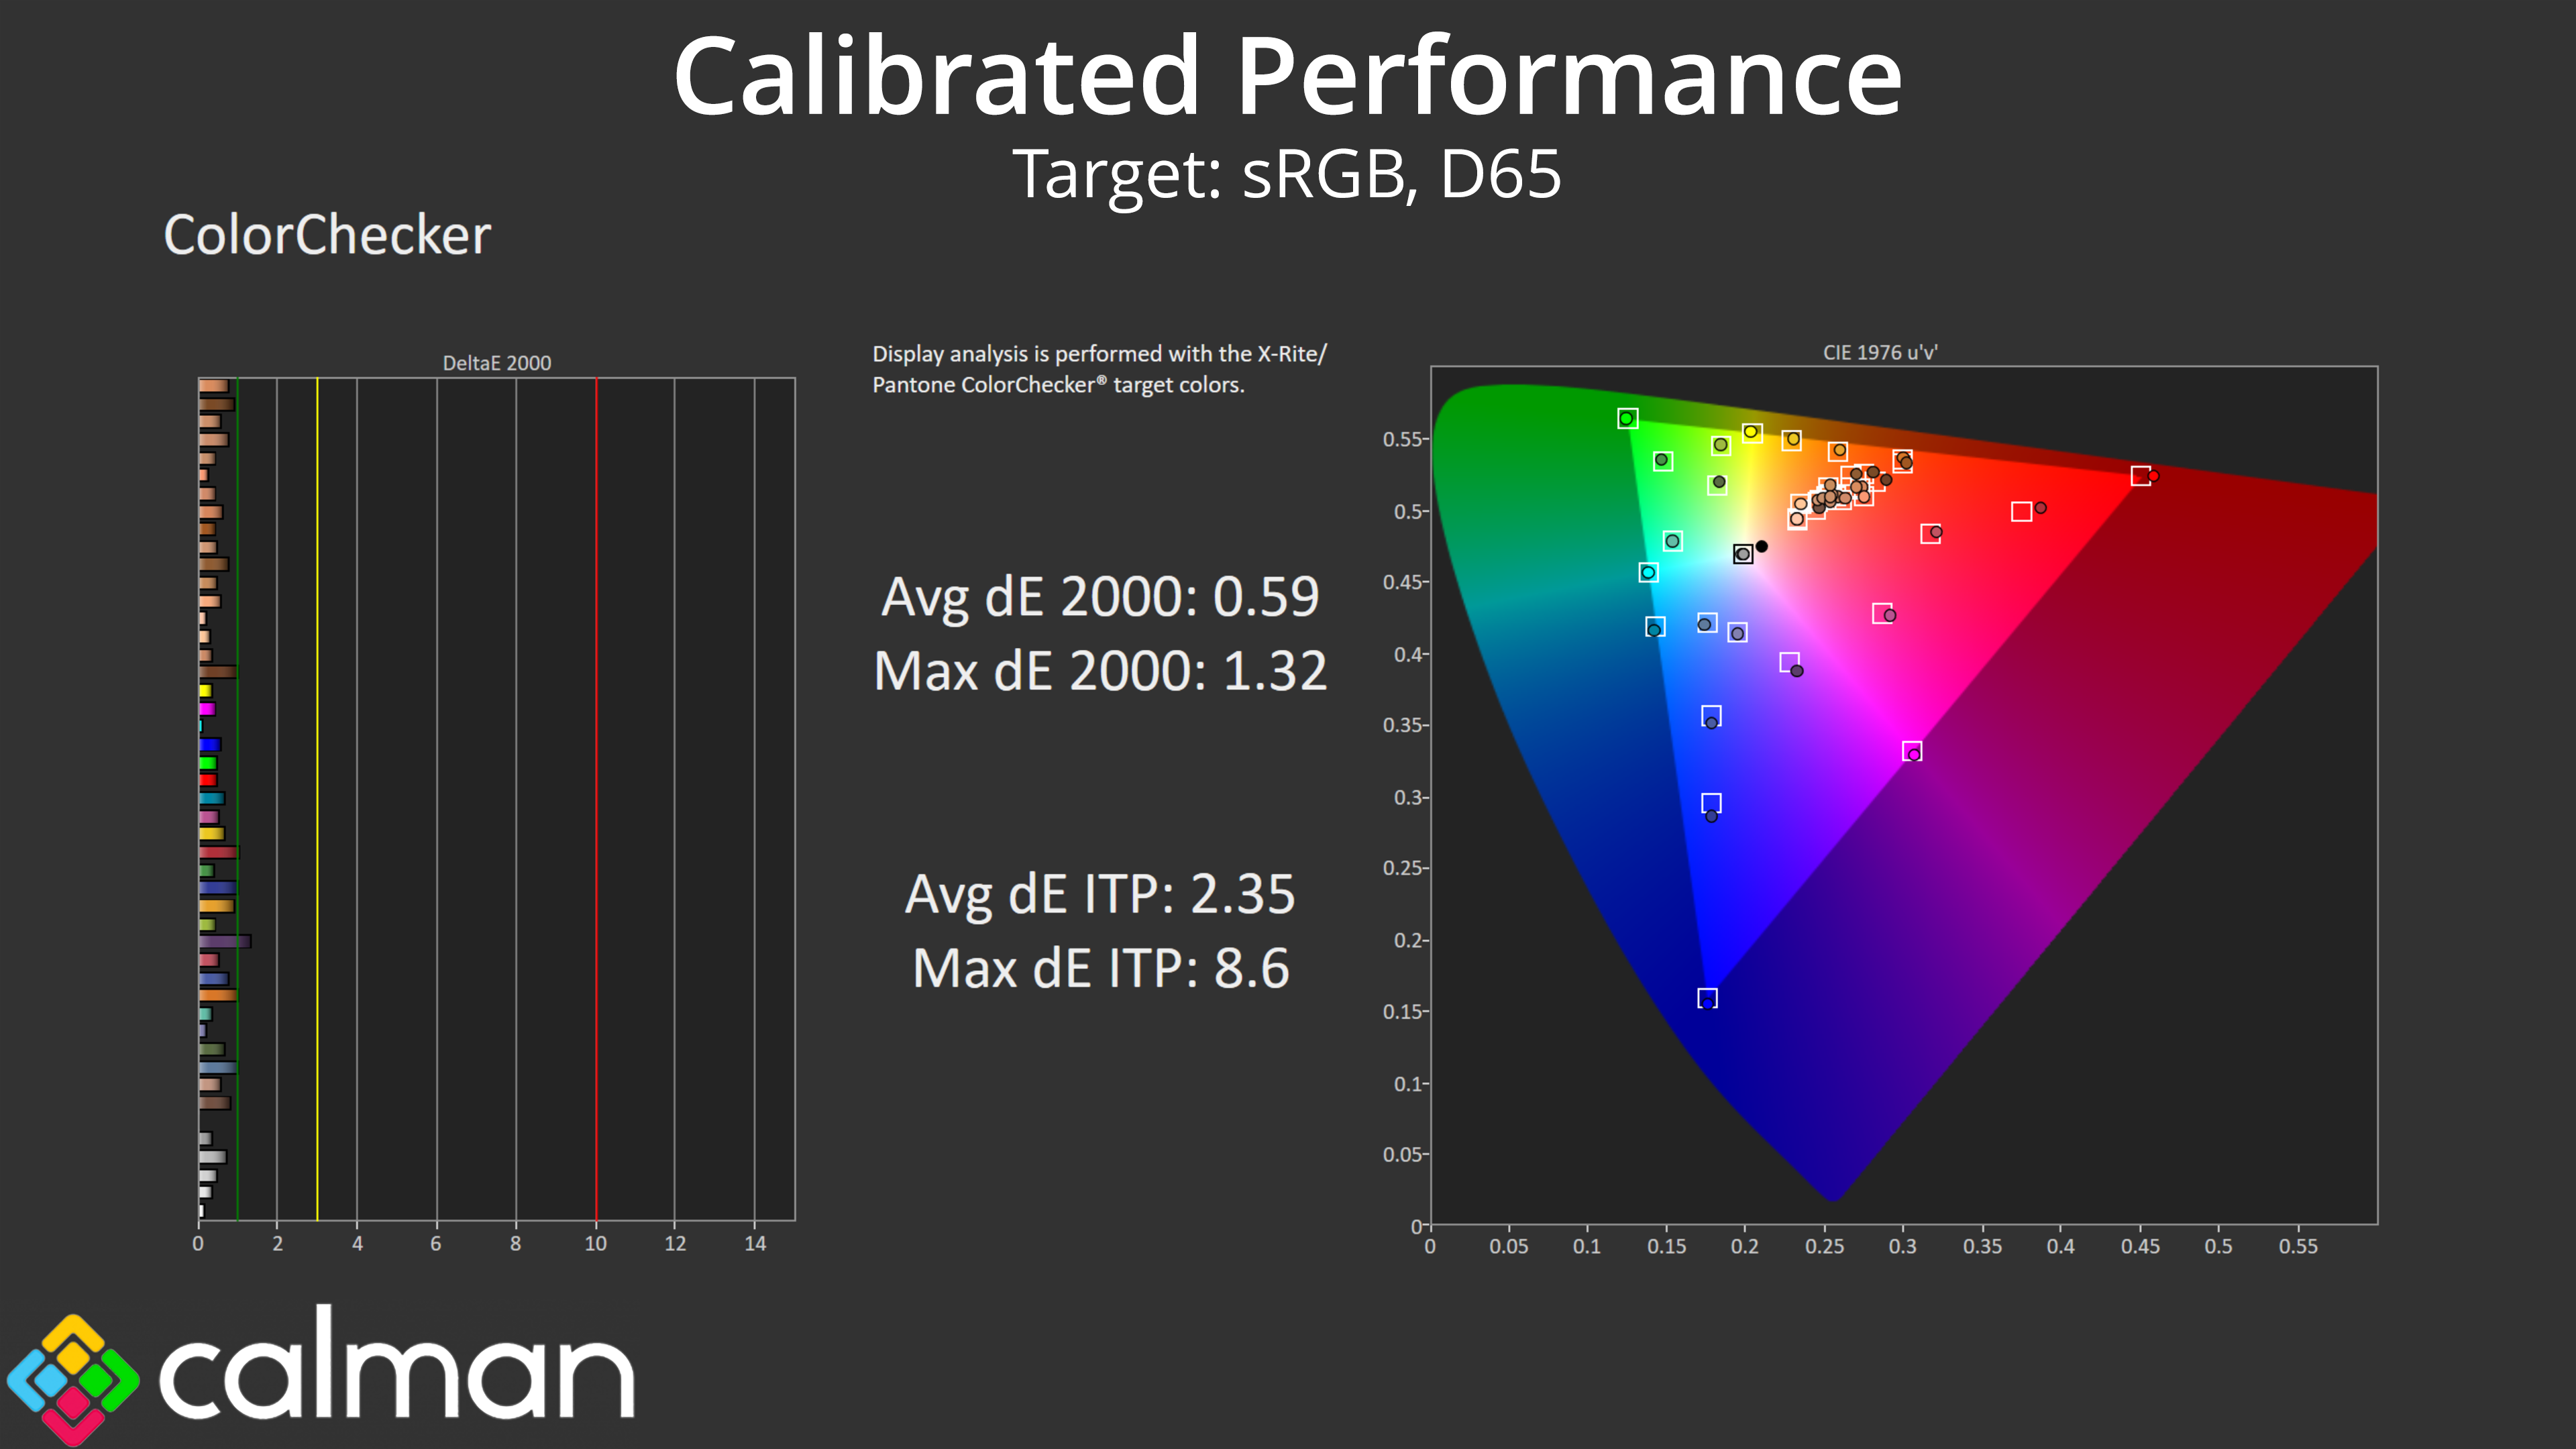
Thankfully, Calman Ultimate did a great job, mapping the sRGB gamut perfectly. It also ironed out the colour balance issues, this time delivering an average CCT of 6473K, with near-flawless gamma tracking too. Colour accuracy also improved tremendously, with an average dE 2000 of 0.59.
 KitGuru KitGuru.net – Tech News | Hardware News | Hardware Reviews | IOS | Mobile | Gaming | Graphics Cards
