3DMark
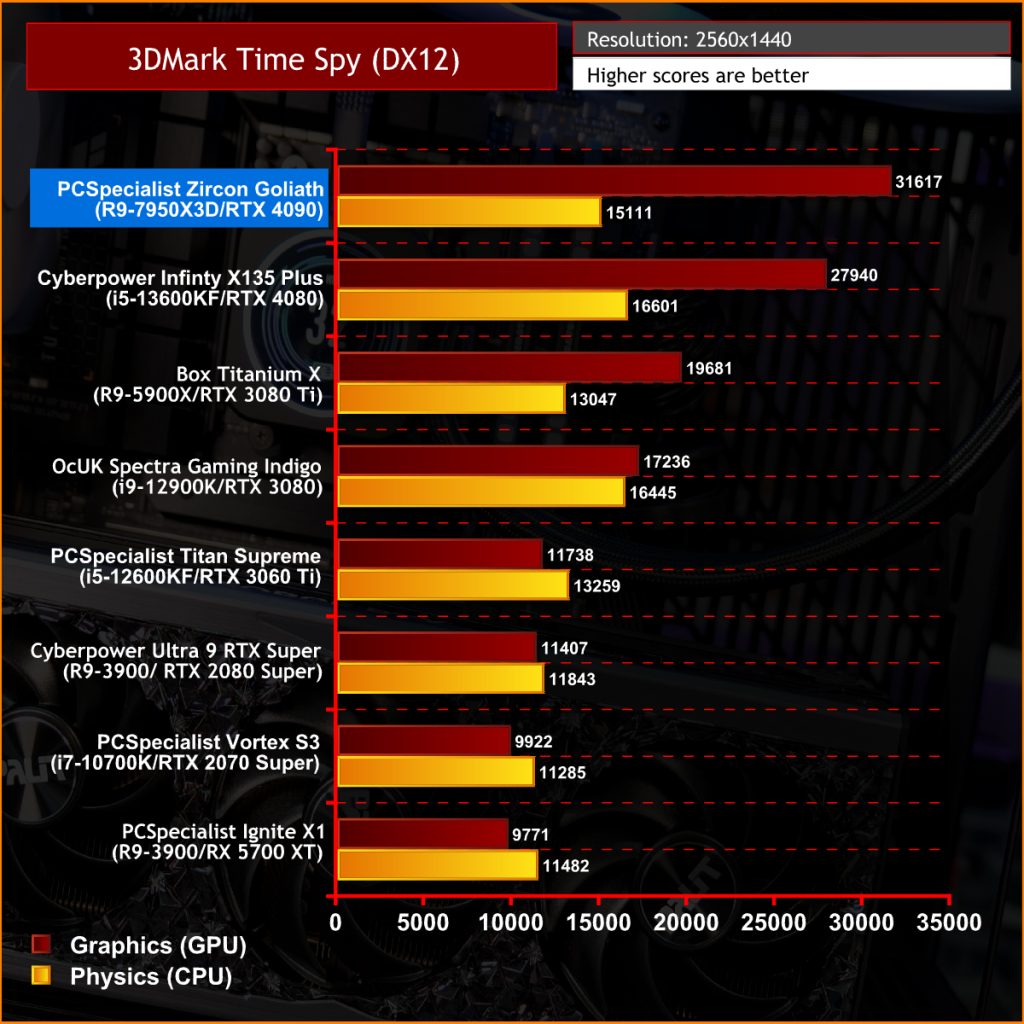
The 3Dmark benchmark is always a good indication of a system’s performance and is a handy tool for comparing your system against others in the database to see if it’s performing as it should. We ran a series of 3DMark benchmarks to test the system’s performance and show the scores achieved for CPU (Physics) and GPU score in our charts below, to compare performance against recent systems that we have tested.
Comparison systems:
Cyberpower Infinity X135 Plus – £2799
OcUK Spectra Gaming Indigo – £2500
Box Titanium X – £3379.99
PCSpecialist Titan Supreme – £1499
Cyberpower Ultra 9 RTX Super – £2099
PCSpecialist Vortex S3 – £1649
PCSpecialist Ignite X1 – £1349

The Time Spy benchmark result for the Zircon Goliath produced a high score but was a little down on what we saw from Dominic’s review of the 4090 Founders edition which is disappointing. The reason for this could be due to heat and GPU core frequency being affected. We will see what’s going on in the thermal tests soon.
Cinebench R23

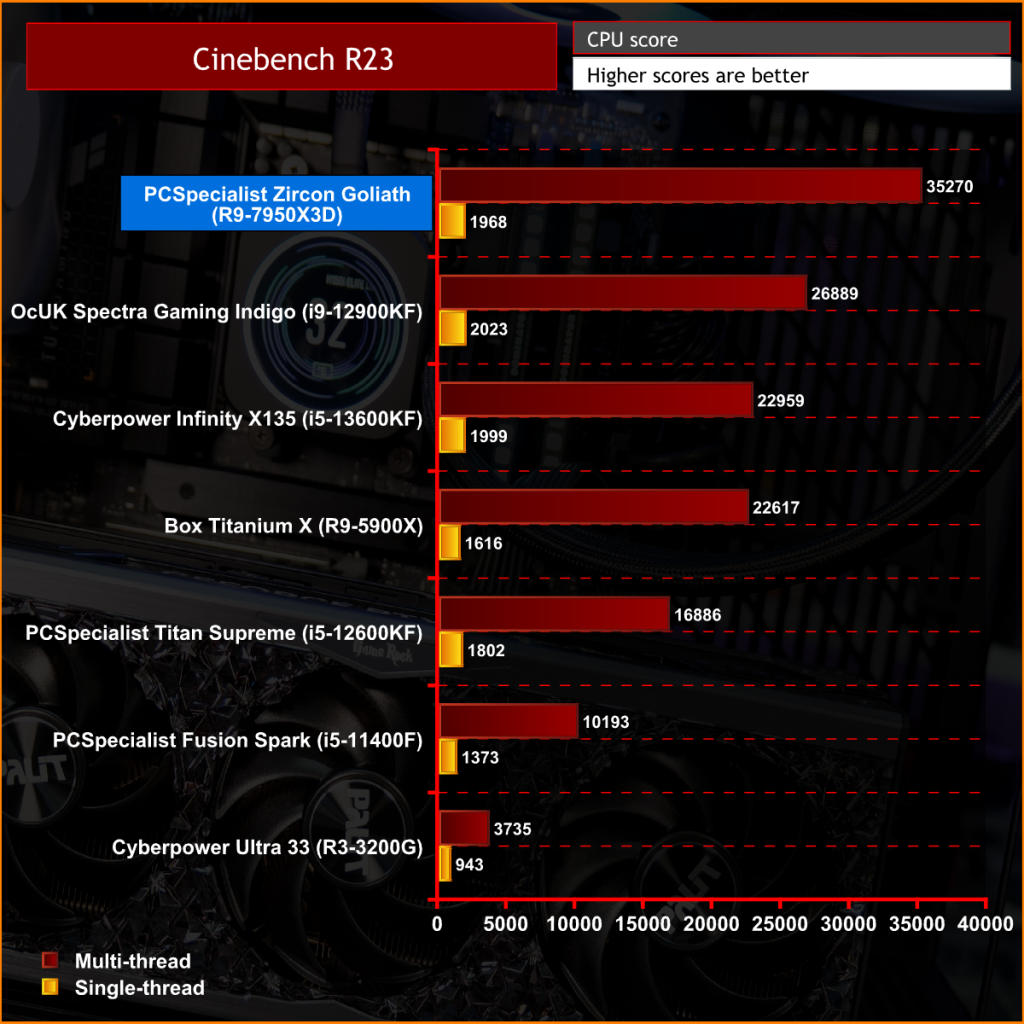
No problems with the Cinebench R23 CPU multi and single-thread scores in the PCSpecialist Zircon Goliath. The AMD Ryzen 9 7950X3D is running these benchmarks with results very similar to what Leo found in his launch review of the 7950X3D so all seems to be good here.
 KitGuru KitGuru.net – Tech News | Hardware News | Hardware Reviews | IOS | Mobile | Gaming | Graphics Cards


