
Hot on the heels of WD's latest NAS-focussed Red drive, the SN700, comes the newest addition to WD's mainstream Blue drive range, the WD Blue SN570. Priced at just £91.99 for the 1TB model, what does the SN570 have to offer in this extremely competitive market?
The new WD Blue SN570 line-up consists of three capacities at launch; 250GB, 500GB and the current flagship 1TB model, the drive we are reviewing here. It seems a little odd that there isn't a 2TB offering at launch, but the previous Blue SN550 model launched with the same three capacities as the SN570, with a 2TB model added at a later date so perhaps the same thing will happen to the SN570 product line.
WD has kept details of the controller and NAND very close to their chest (at the time of writing) but we presume that the controller is an improved version of the one that was used by the previous Blue SN550 and the NAND is the latest BiCS5, 112-layer 3D TLC NAND.
WD quote Sequential read figures for the three SN570 drives as up to 3,300MB/s for the 250GB drive and 3,500MB/s for both the 500GB and 1TB models, all three having faster read speeds than the previous SN550 which was rated up to 2,400MB/s across the range (excluding the 2TB drive). Sequential write performance is quoted as up to 1,200MB/s for the 250GB drive (up from 950MB/s for the SN550), 2,300MB/s for the 500GB drive (up from 1,750MB/s) and up 3,000MB/s for the 1TB drive (up from 1,950MB/s).
Random performance is quoted as up to 190,000 IOPS and 210,000 IOPS read/writes respectably for the 250GB drive, the 500GB drive gets figures of up to 360,000 IOPS for reads and up to 390,000 IOPS for writes while the 1TB drive is rated up to 460,000 IOPS and 450,000 IOPS for read and writes respectively.
WD quote an endurance figure for the 1TB drive of 600TBW with the 250GB drive rated at 150 TBW and a 300TBW figure for the 500GB drive. WD backs the range with a 5-year limited warranty.
Physical Specifications:
- Usable Capacities: 1TB.
- NAND Components: SanDisk BiCS5 112-Layer 3D TLC NAND?
- NAND Controller: WD in-house.
- Cache: none.
- Interface: PCIe Gen3 x4, NVMe 1.4.
- Form Factor: M.2, 2280.
- Dimensions: 22 x 80 x 2.38mm.
- Drive Weight: 6g.
Firmware Version: 234090WD.
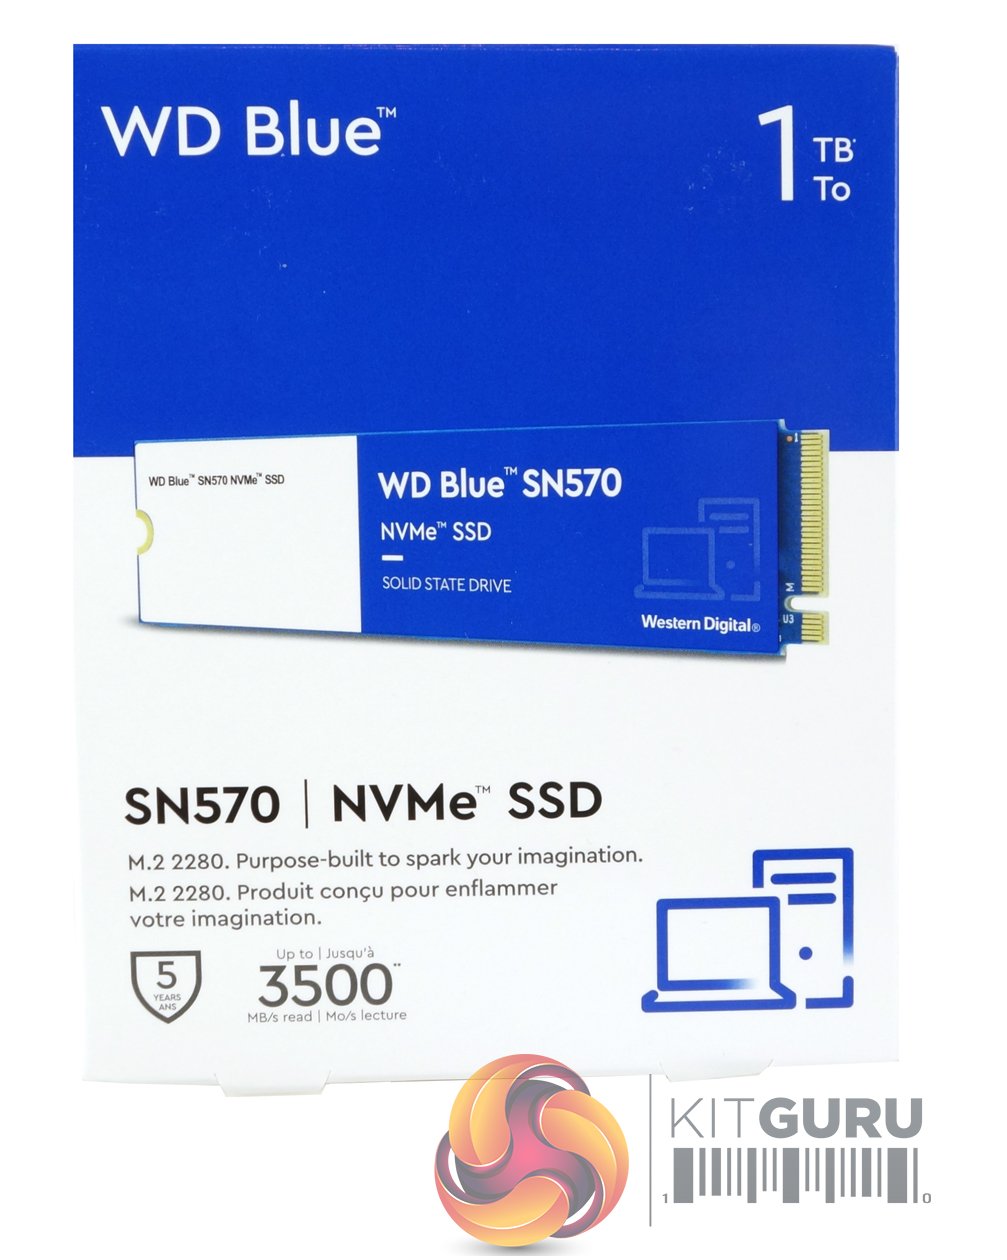
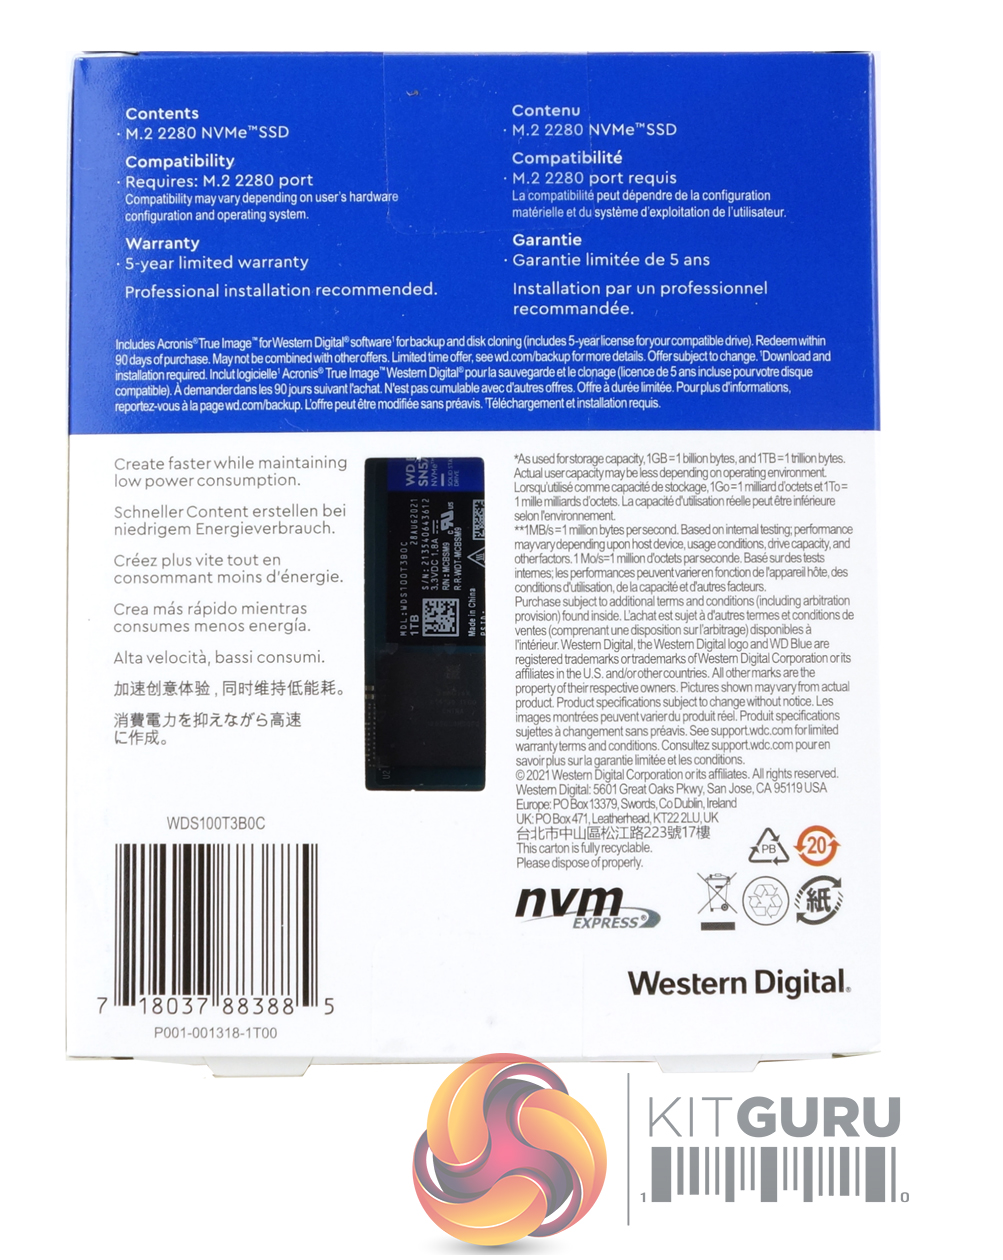
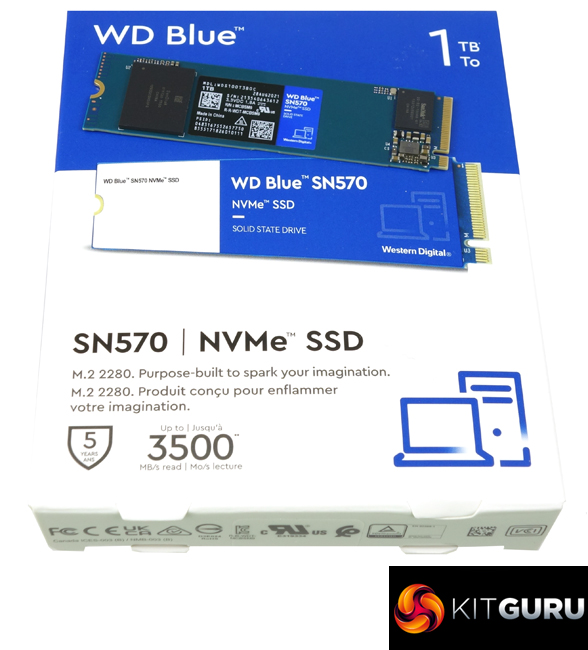
The WD Blue SN570 comes in a smallish box with a clear image of the drive on the front. Under the image is a line of text that tells you that it's an M.2 2280 drive and under this is an icon displaying the fact that the drive is supported by a 5-year warranty and the Sequential read figure (up to 3,500MB/s). The rear of the box has a small clear plastic panel through which part of the drive is visible, sitting in its protective plastic enclosure. The only other thing in the box is a Technical Support and Warranty Guide.
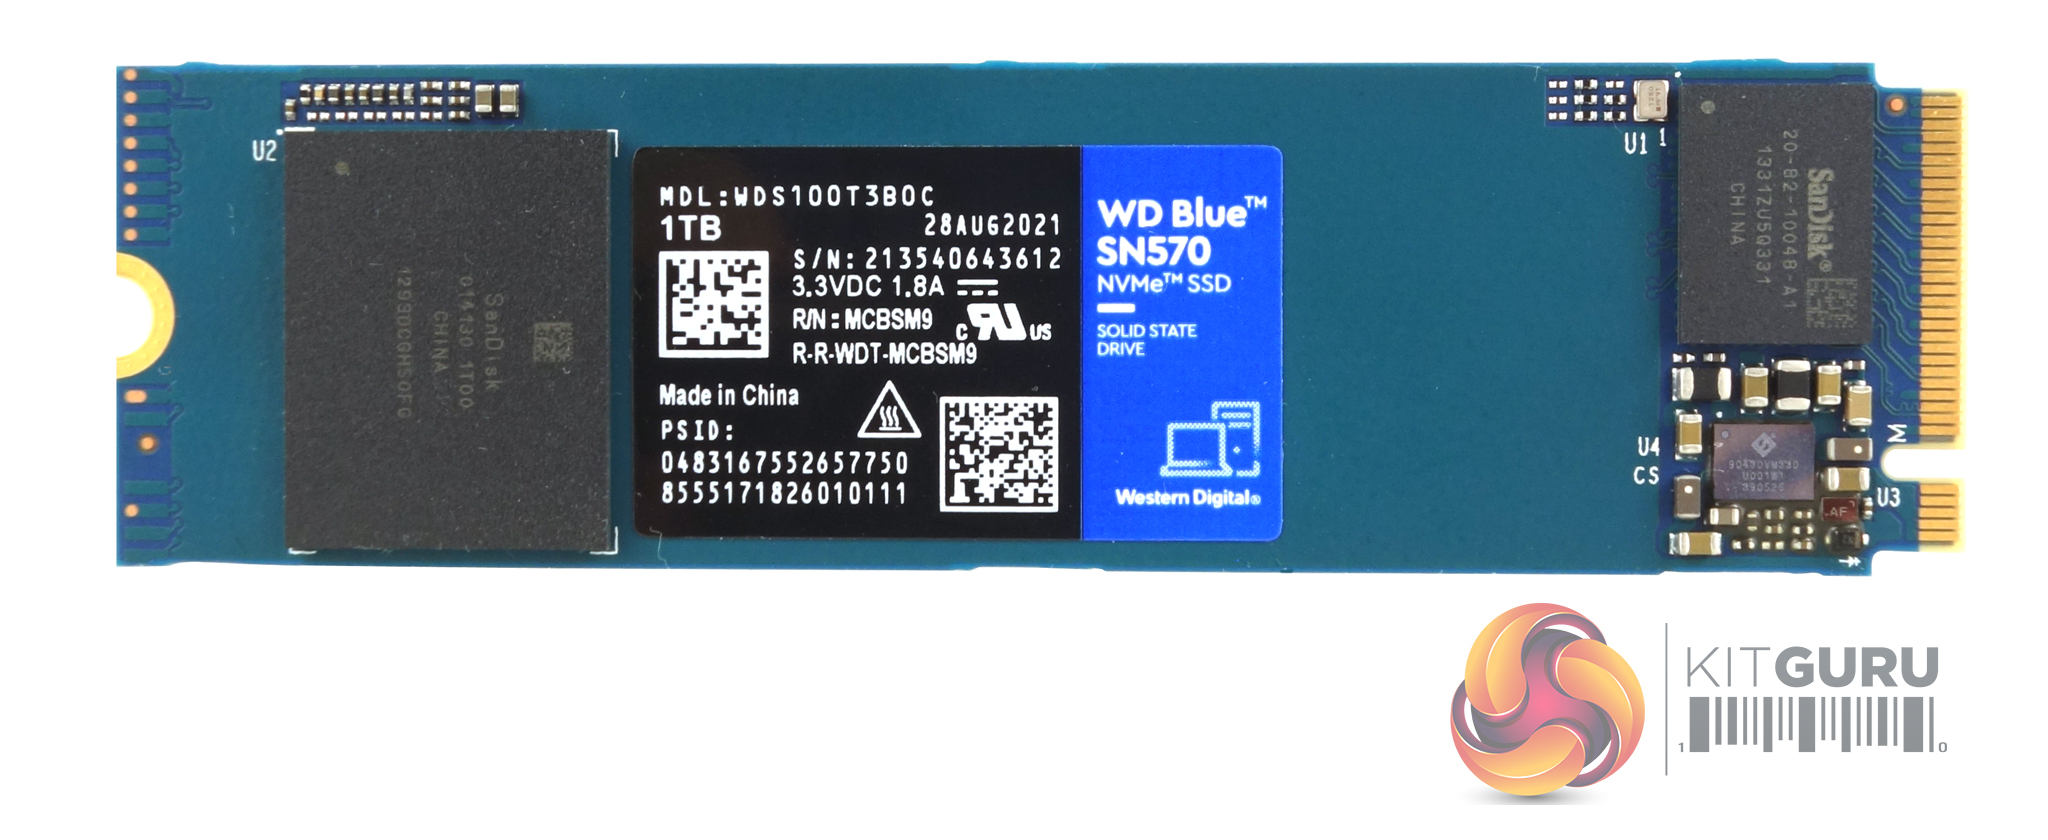
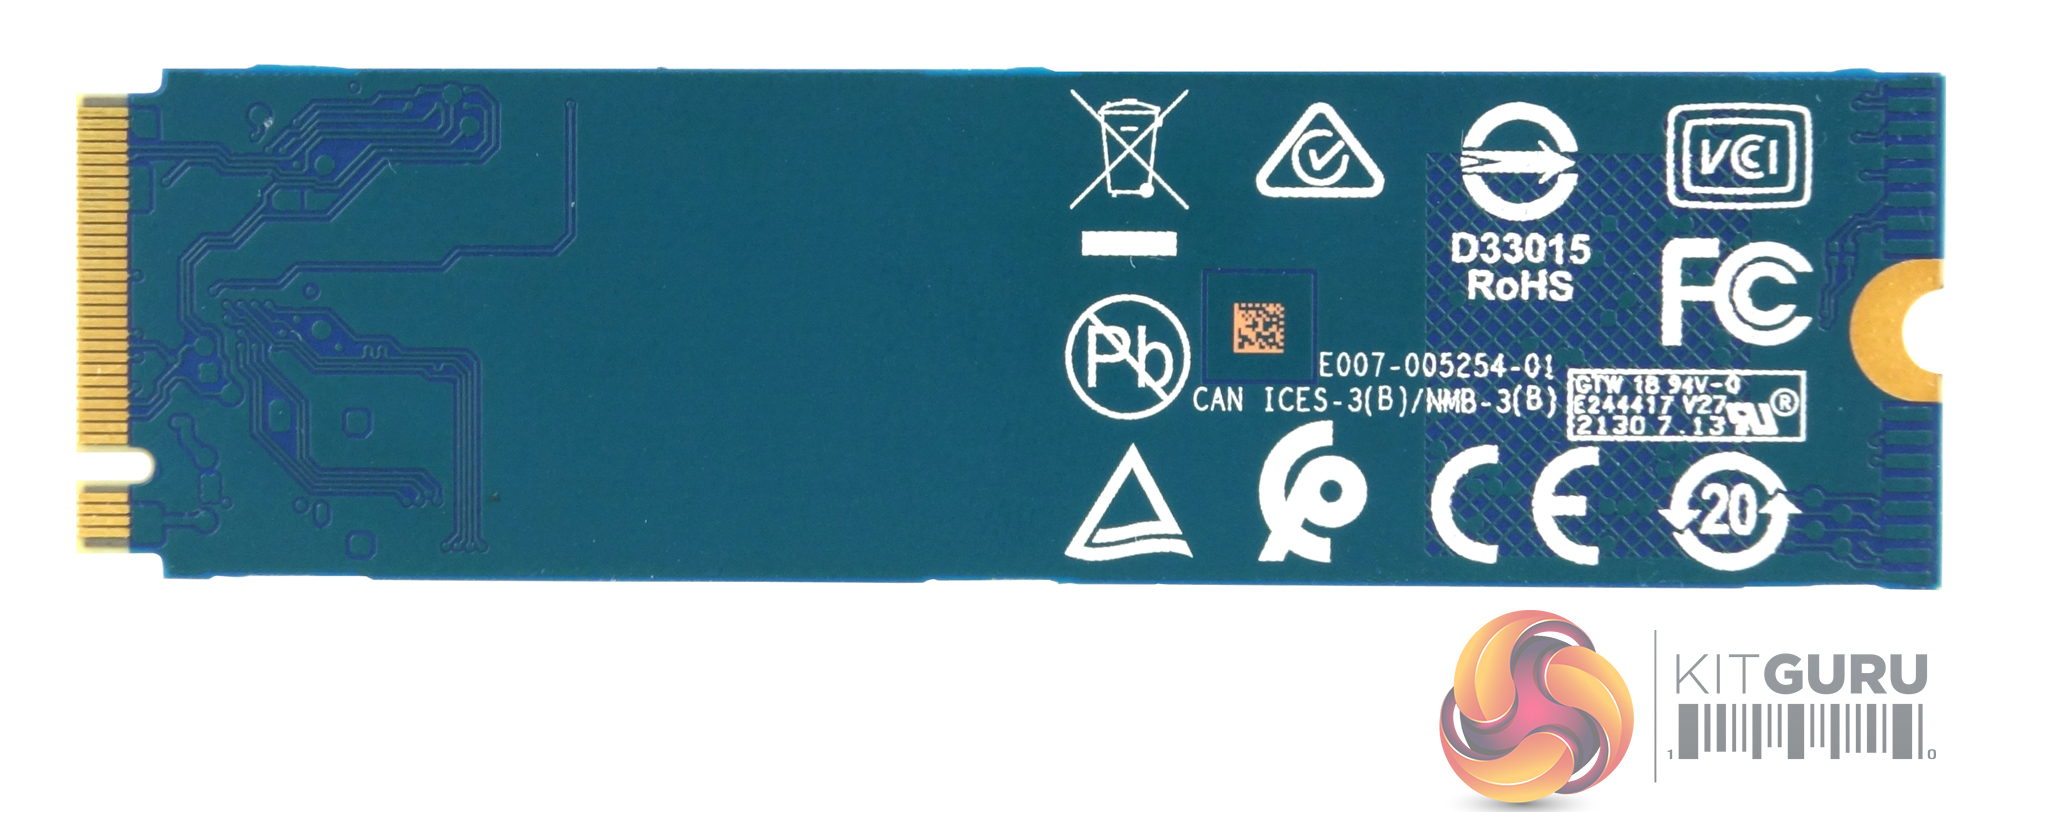
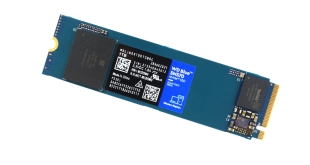
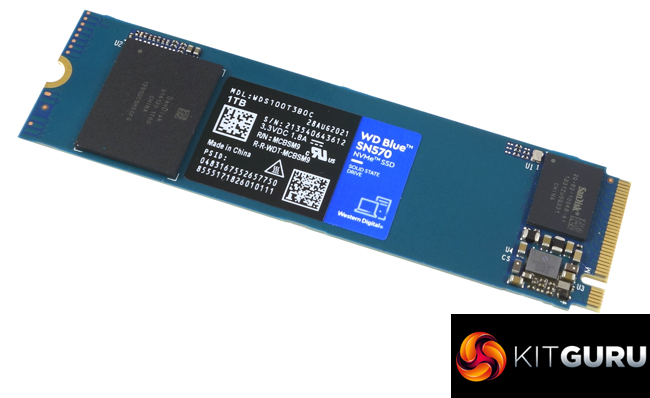
WD’s 1TB Blue SN570 is a single-sided PCB design, so the rear of the drive is empty, mind you, just like the previous Blue SN550, the SN570 is a DRAM-less design so with only a single NAND (the best guess is 112-layer 3D TLC ) package (coded Sandisk 014130 1T00) and a power management chip to accompany the WD in-house controller (coded 20-82-10048-A1), the front of the PCB isn't exactly full to the brim either.
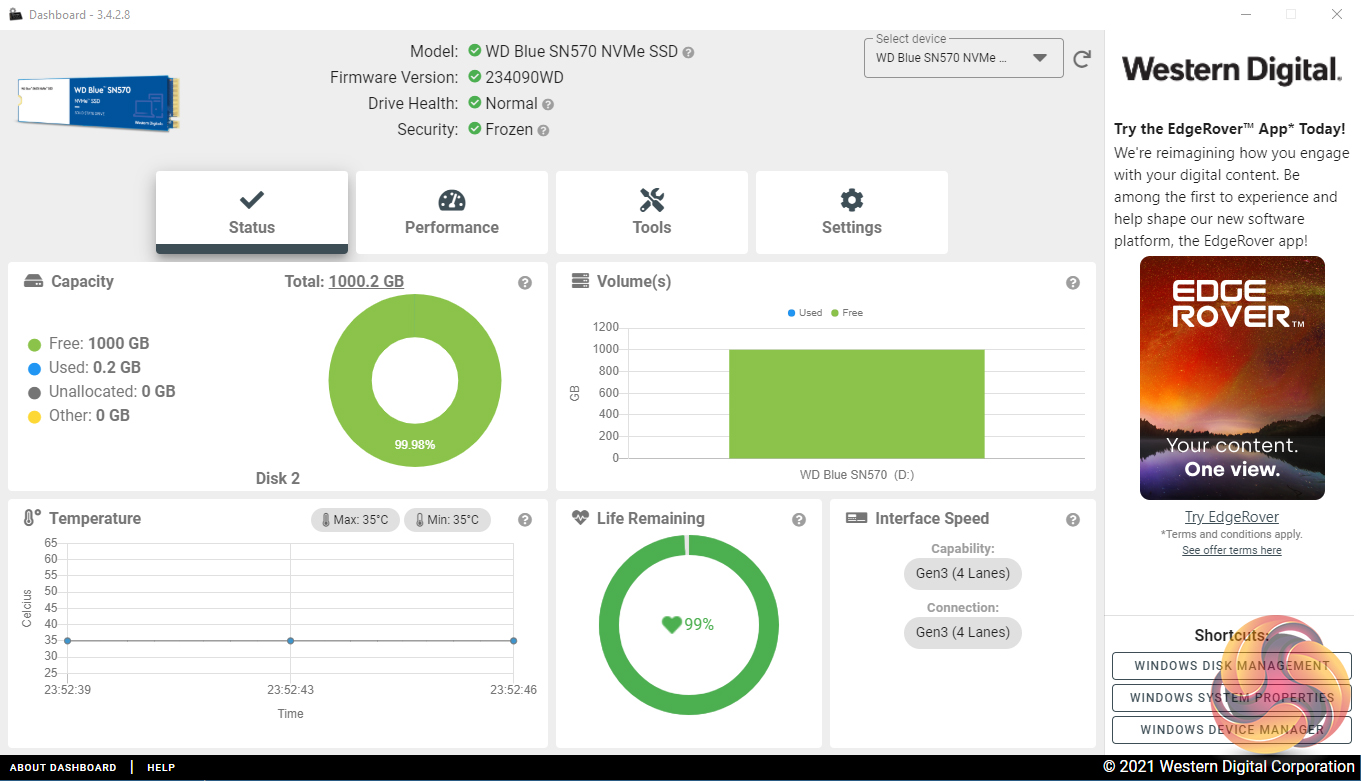
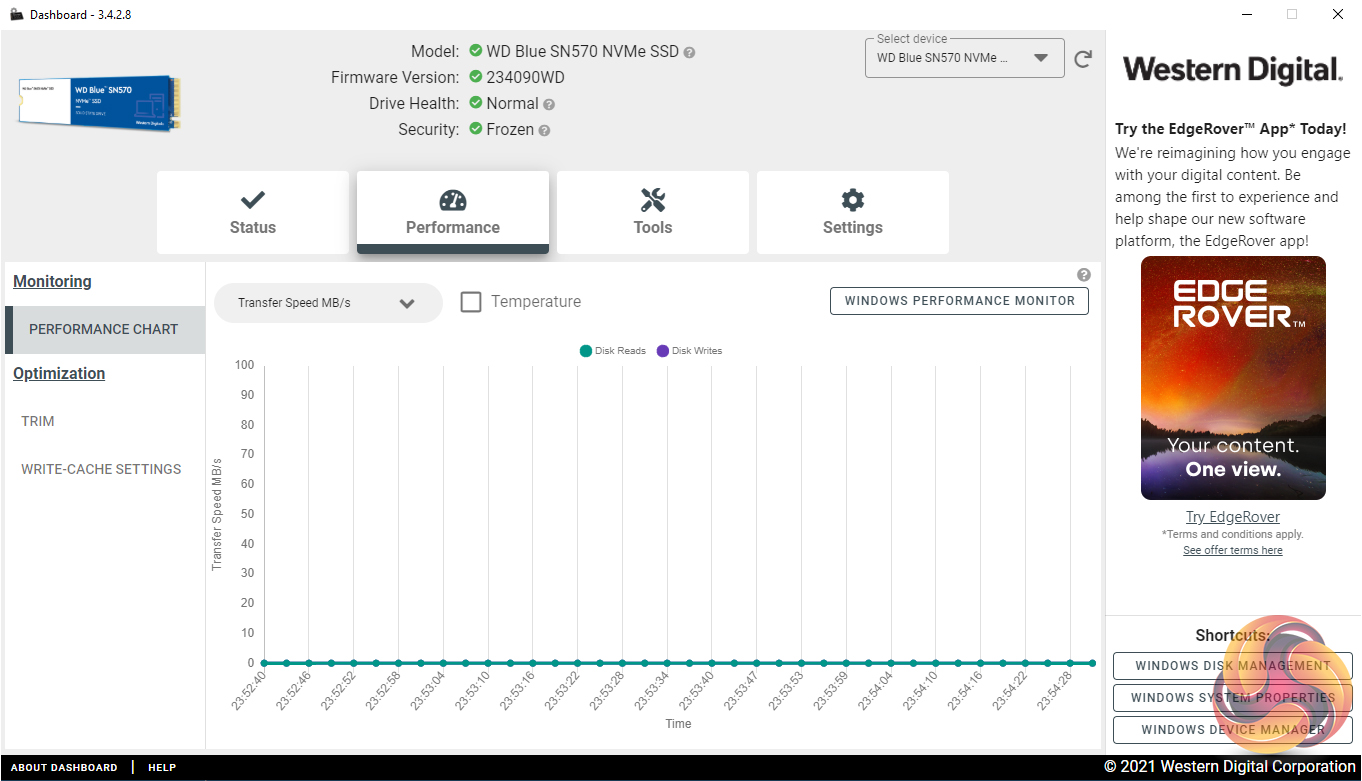
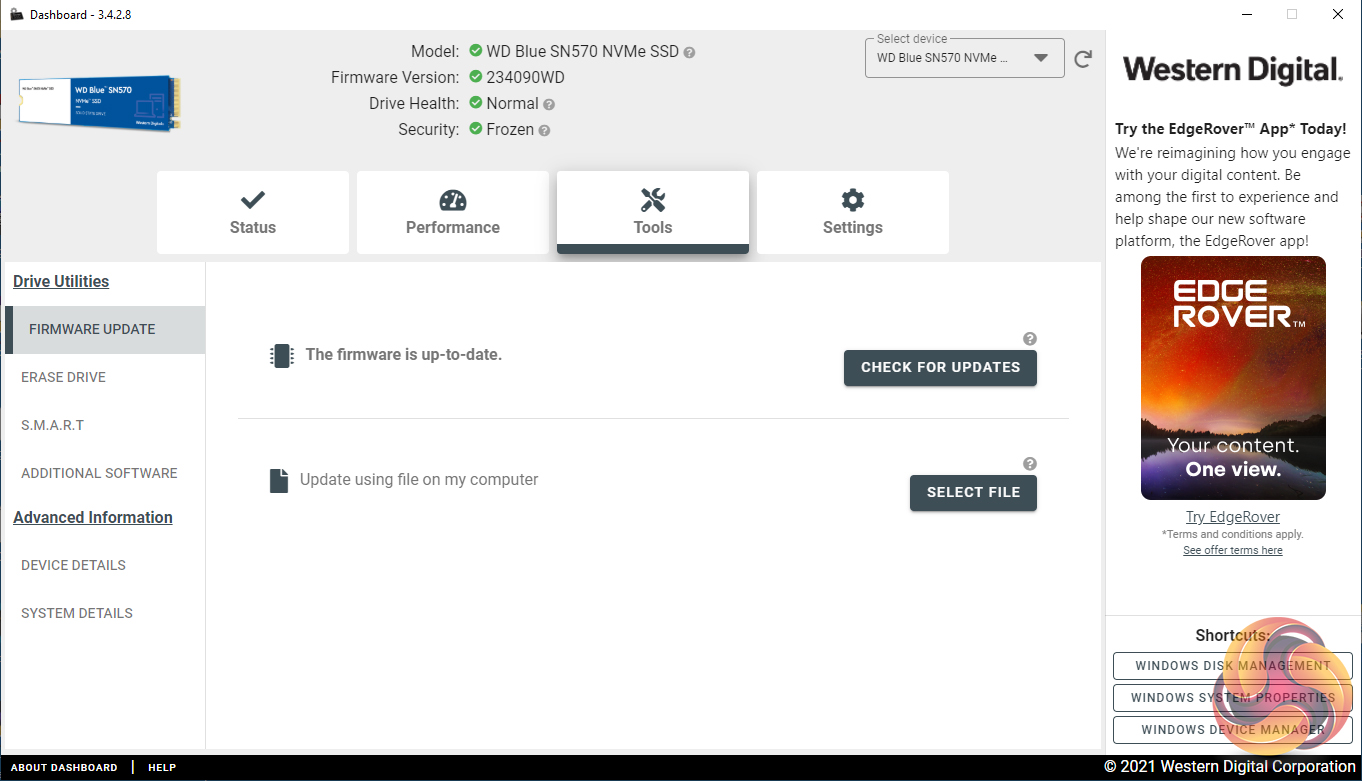
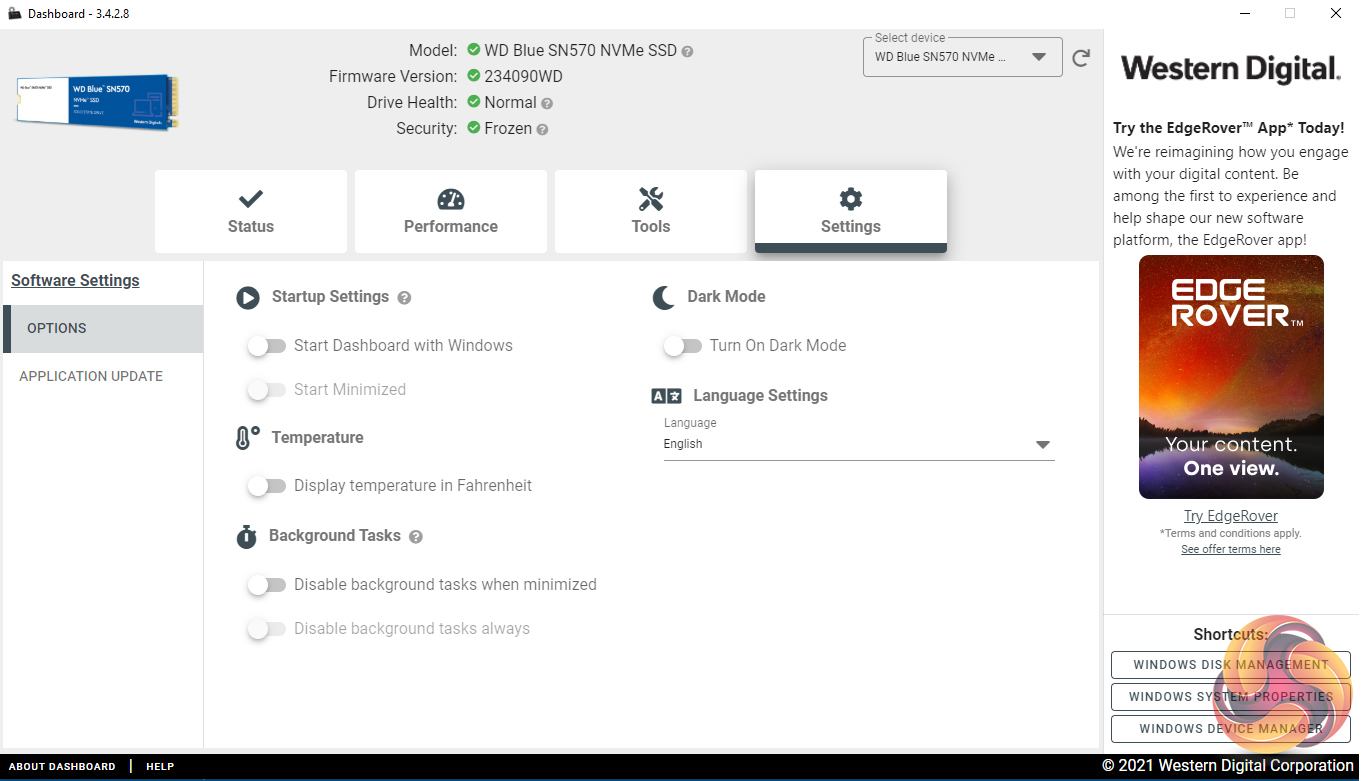
WD’s SSD management utility goes under the name of SSD Dashboard. With it, you can monitor drive status, performance, update firmware and monitor temperatures. There’s no cloning tool integrated into the utility but you can download Acronis True Image WD Edition from the WD website. There is also an option to change the layout to a dark mode.
For testing, the drives are all wiped and reset to factory settings by HDDerase V4. We try to use free or easily available programs and some real-world testing so you can compare our findings against your own system.
This is a good way to measure potential upgrade benefits.
Main system:
AMD Ryzen 5 3600X, 16GB DDR4-2400, Sapphire R9 390 Nitro and an MSI MPG X570 Gaming Edge Wifi motherboard
Other drives
Acer FA100 1TB
Corsair MP400 2TB
Corsair Force MP510 960GB
Crucial P1 1TB
Kingston KC2000 1TB
Kingston KC2500 1TB
Patriot P300 1TB
Patriot Viper VPR100 RGB 1TB
Patriot Viper VPN100 1TB
PNY CS3030 1TB
Seagate IronWolf 510 1.92TB
Seagate FireCuda 510 1TB
Samsung SSD970 PRO 1TB
Samsung SSD960 EVO 1TB
Samsung SSD960 EVO Plus 1TB
Samsung SSD980 1TB
Kioxia Exceria Plus 2TB
Kioxia Exceria NVMe 1TB
Kioxia BG4 1TB
Kioxia XG6 1TB
Western Digital Black SN750 1TB
Western Digital Black SN750 1TB with Heatsink
Western Digital Blue SN550 1TB
Western Digital Red SN700 1TB
Software:
Atto Disk Benchmark 4.
CrystalMark 7.0.0.
AS SSD 2.0.
IOMeter.
Futuremark PC Mark 10.
All our results were achieved by running each test five times with every configuration this ensures that any glitches are removed from the results. Trim is confirmed as running by typing fsutil behavior query disabledeletenotify into the command line. A response of disabledeletenotify =0 confirms TRIM is active.
CrystalDiskMark is a useful benchmark to measure theoretical performance levels of hard drives and SSD’s. We are using v6.0 and 8.0.
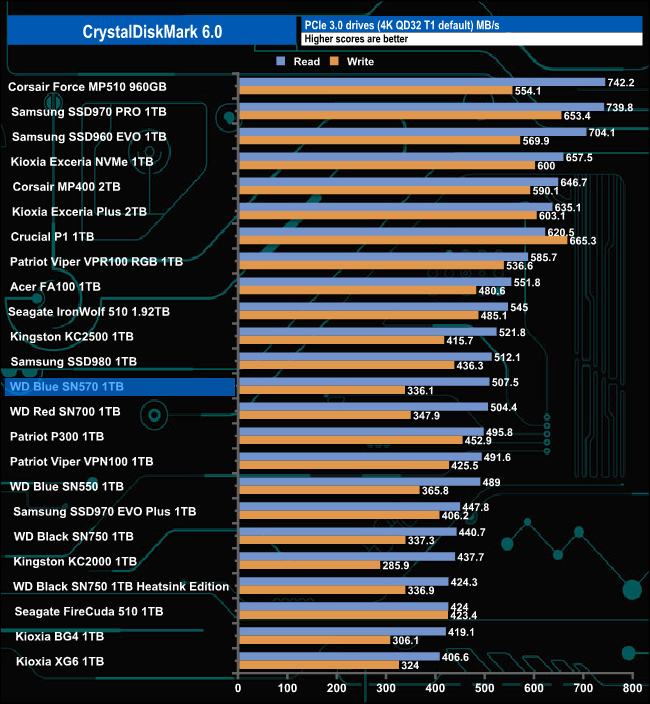
In the CrystalDiskMark QD32 T1 test, the Blue SN570 shows an improvement in read performance over the previous Blue SN550 but the older drive has the edge when it comes to writes.
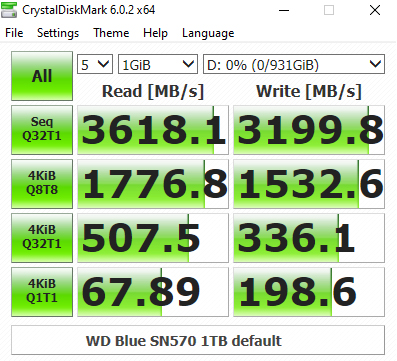
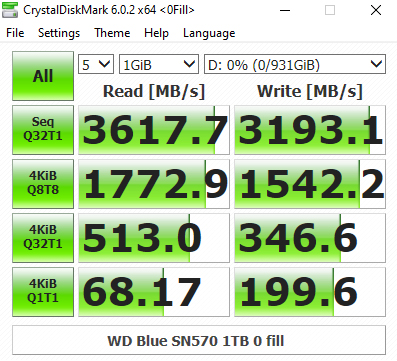
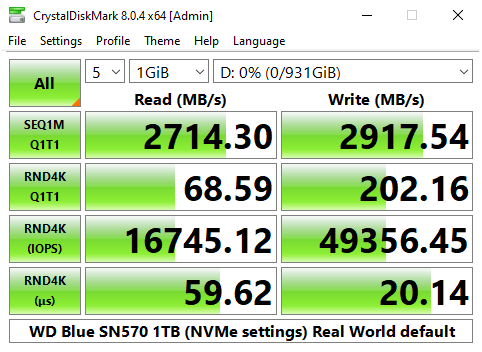
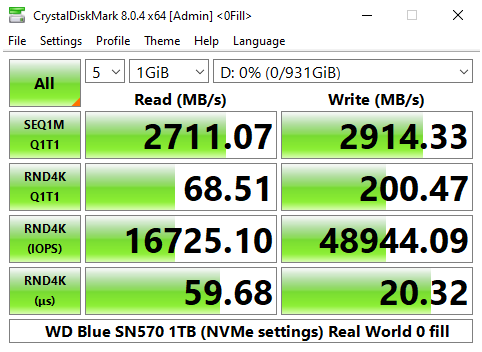
Looking at the two benchmark screens, it's clear that the in-house WD controller doesn't have a preference for the type of data it's being asked to handle. We could also confirm the official Sequential performance figures for the drive, up to 3,500MB/s and up to 3,000MB/s for reads and writes respectively with a best test read performance of 3,618MB/s and writes of 3,199MB/s.
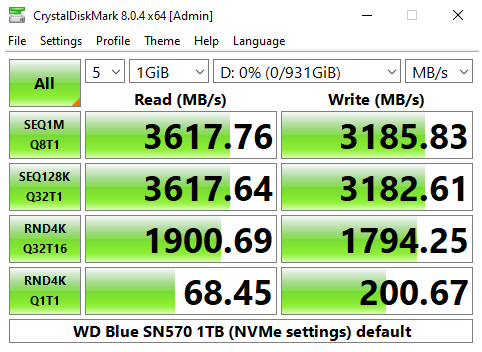
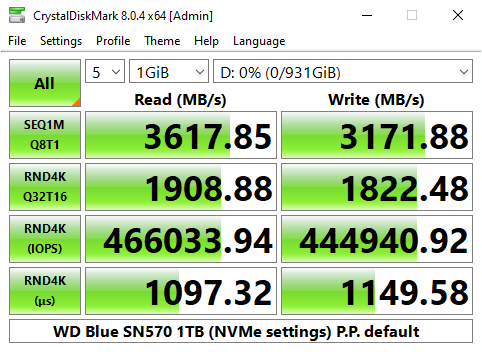
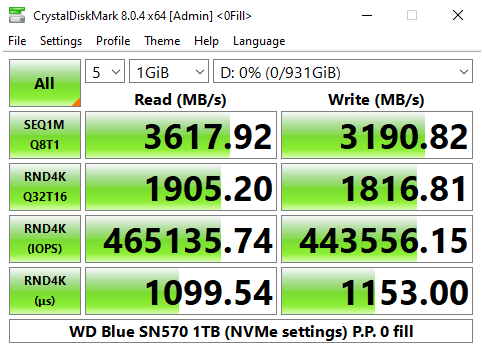
CrystalDiskMark 8 default.
CrystalDiskMark 8 Peak Performance profile.
CrystalDiskMark 8 Real World profile.
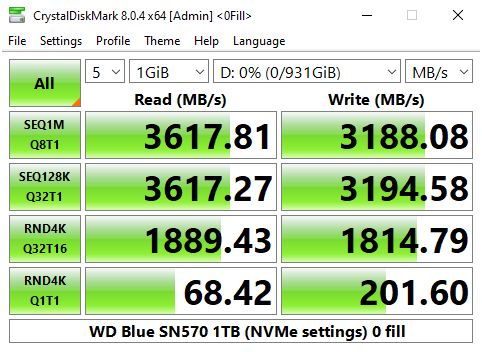
Using the more advanced CrystalDiskMark 8 in its default setting as well as the Peak Performance and Real World profiles saw the Sequential test results confirm the official 3,500MB/s reads and 3,000MB/s writes with the best results of 3,617MB/s and 3,190MB/s for reads and writes respectively.
Similarly using the Peak Performance profile to gauge the 4K performance of the drive we could confirm the official random read maximum of 460,000 IOPS with a test result of 466,033 IOPS. The drive produced a best random write test result of 444,940 IOPS, a little shy of the official maximum of 450,000 IOPS.
The ATTO Disk Benchmark performance measurement tool is compatible with Microsoft Windows. Measure your storage systems performance with various transfer sizes and test lengths for reads and writes. Several options are available to customize your performance measurement including queue depth, overlapped I/O and even a comparison mode with the option to run continuously. Use ATTO Disk Benchmark to test any manufacturers RAID controllers, storage controllers, host adapters, hard drives and SSD drives and notice that ATTO products will consistently provide the highest level of performance to your storage.
We are using version 4.0 for our NVMe disk tests.
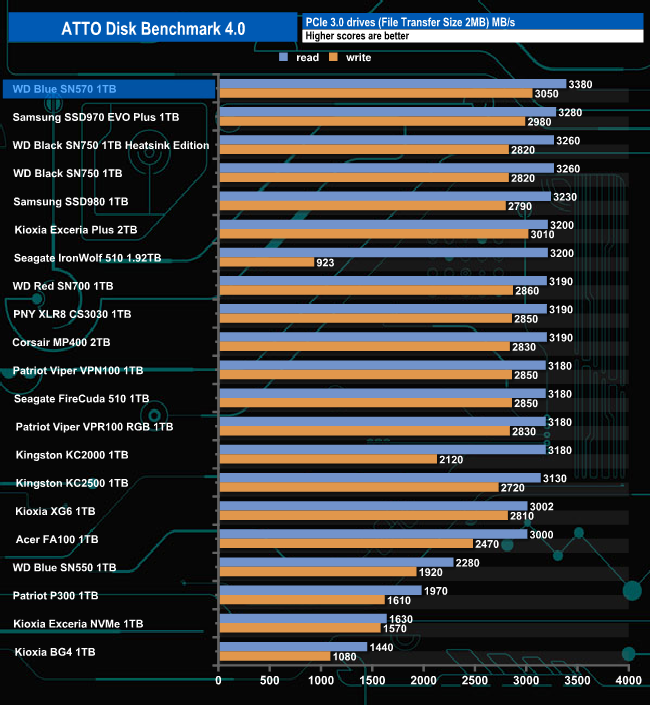
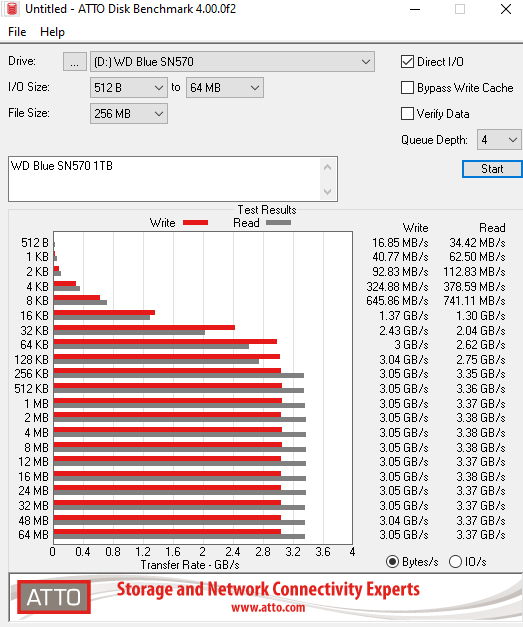
With the ATTO benchmark, we couldn't quite hit the official maximum Sequential read figure of 3,500MB/s with a test result of 3,380MB/s but the 3,050MB/s write result is a little better than the official maximum of 3,000MB/s. Although the 3,380MB/s read test result doesn't quite hit the official maximum, it's still good enough to place the SN570 at the top of the ATTO performance chart.
AS SSD is a great free tool designed just for benching Solid State Drives. It performs an array of sequential read and write tests, as well as random read and write tests with sequential access times over a portion of the drive. AS SSD includes a sub suite of benchmarks with various file pattern algorithms but this is difficult in trying to judge accurate performance figures.
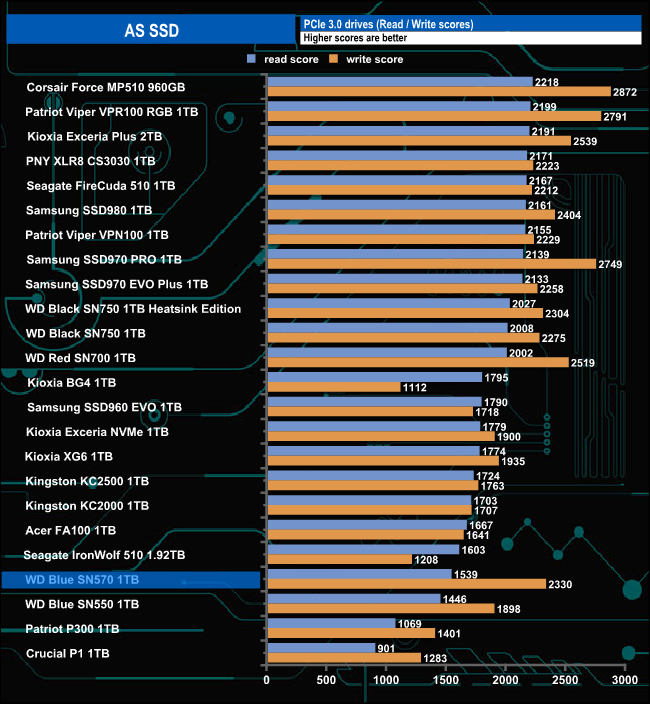
The WD Blue SN570 doesn't fare that well in the demanding AS SSD benchmark but it does perform better than the previous WD Blue SN550 for both reads and writes.
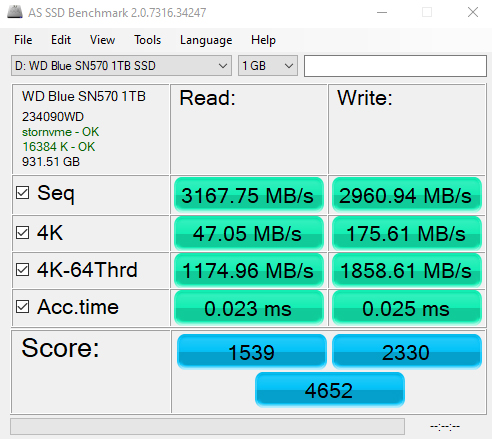
Using our own Sequential tests we could confirm the official figures of 3,500MB/s for reads and 3,000MB/s for writes with a read result of 3,617MB/s with writes at 3,178.14MB/s.
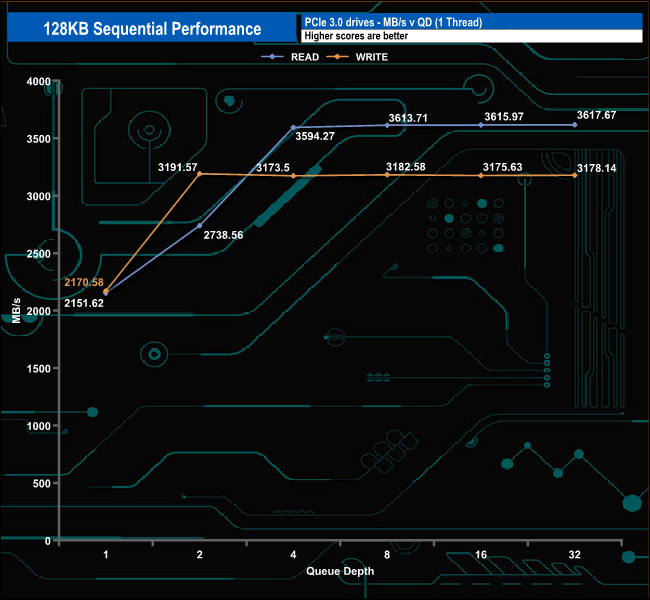
128KB Sequential Read Performance compared.
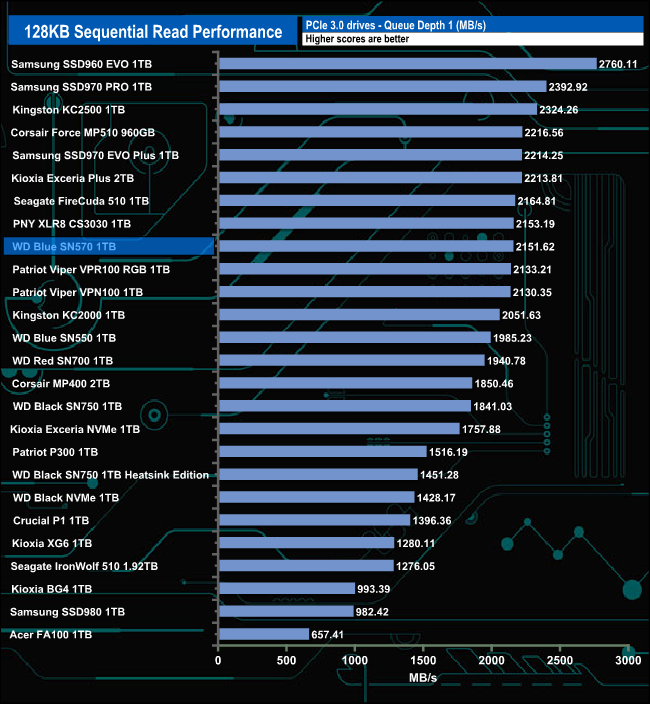
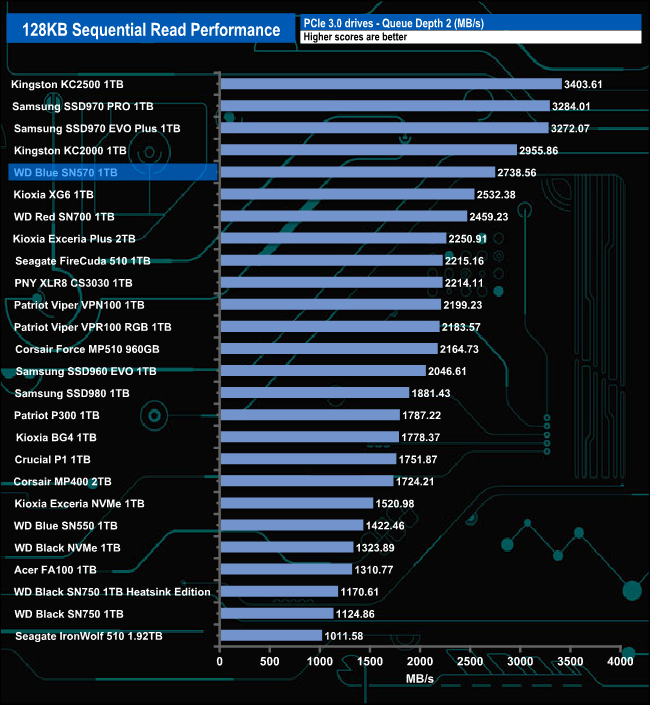
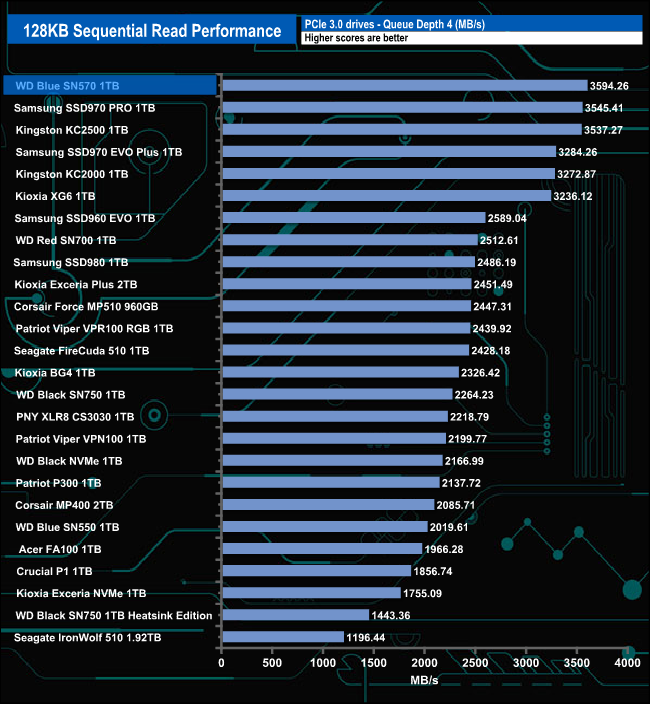
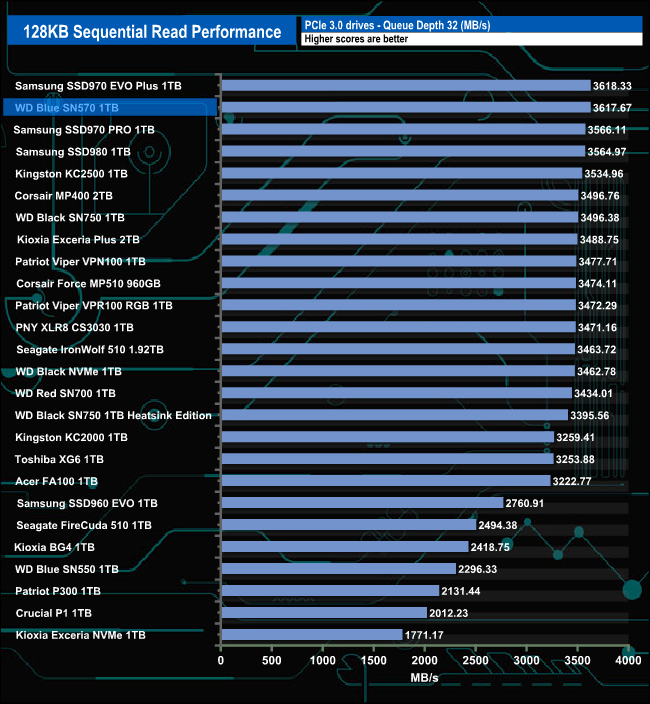
The drive's best performance comes at the QD4 where it tops the Sequential read performance charts with a test result of 3,594.26MB/s and is only just behind Samsung's SSD970 EVO Plus at QD32.
128KB Sequential Write Performance compared.
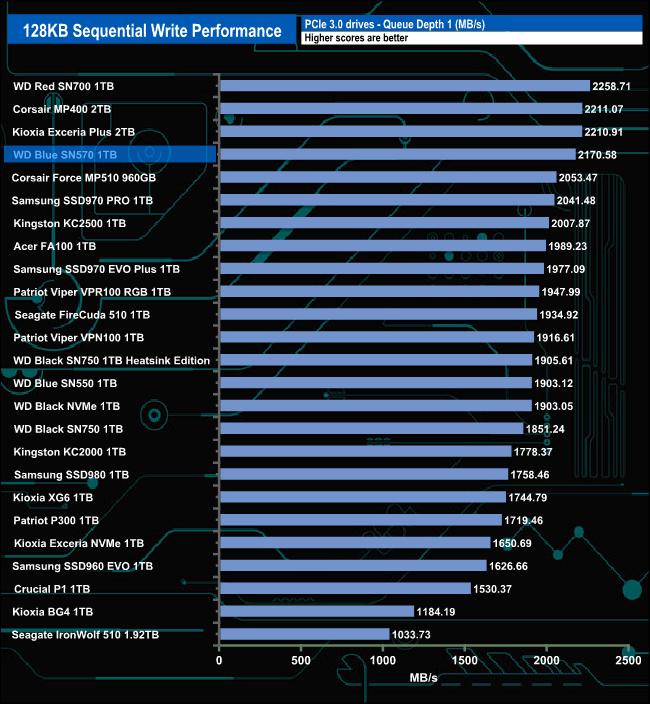
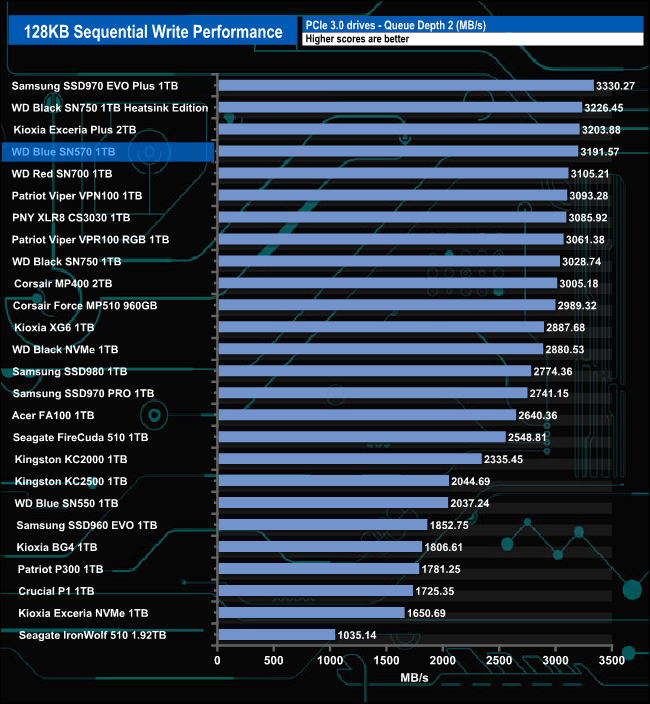
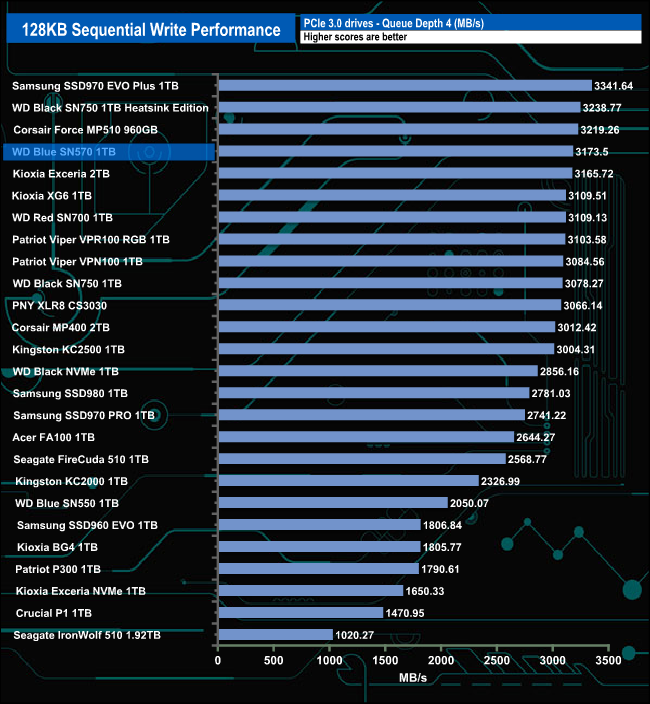
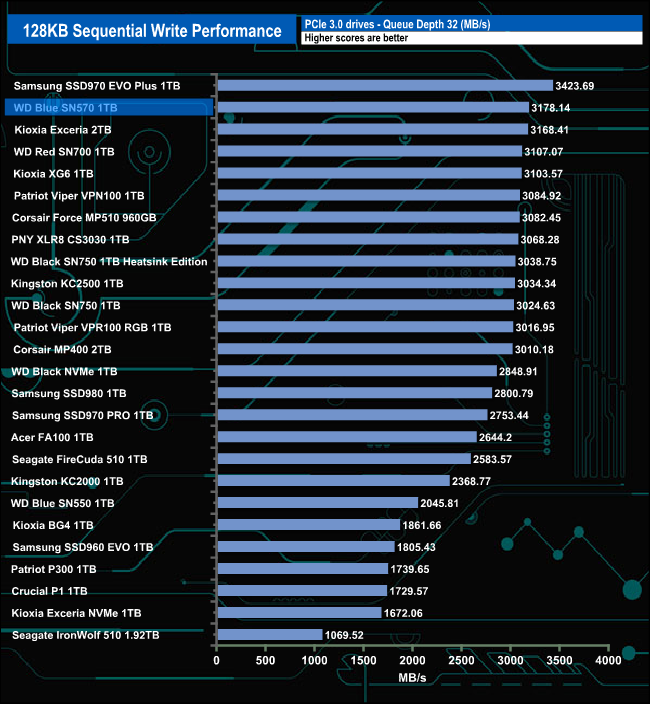
The WD Blue SN570 displays a good degree of consistency when it comes to Sequential writes with the best performance compared to the drives around it coming at QD32 with a test result figure of 3,178.14MB/s.
We test the 4K random read performance of a drive through a range of queue depths. The setup for the tests is listed below.
4K Random Read
Transfer Request Size: 4KB, Outstanding I/O: 1-32.
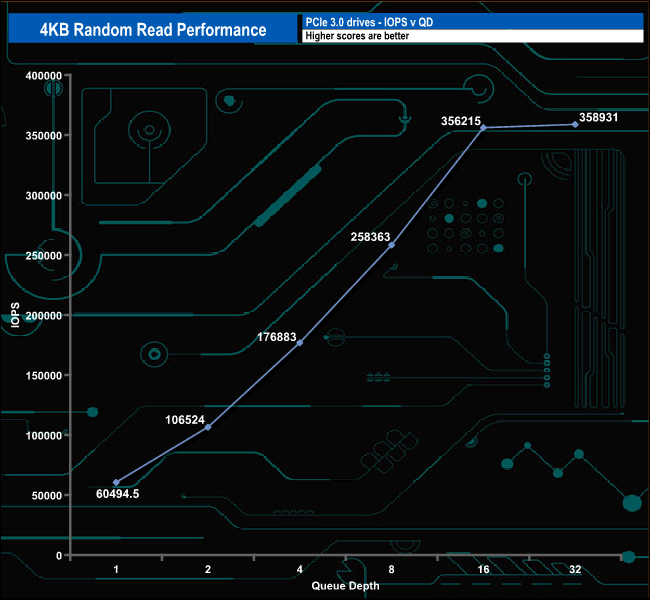
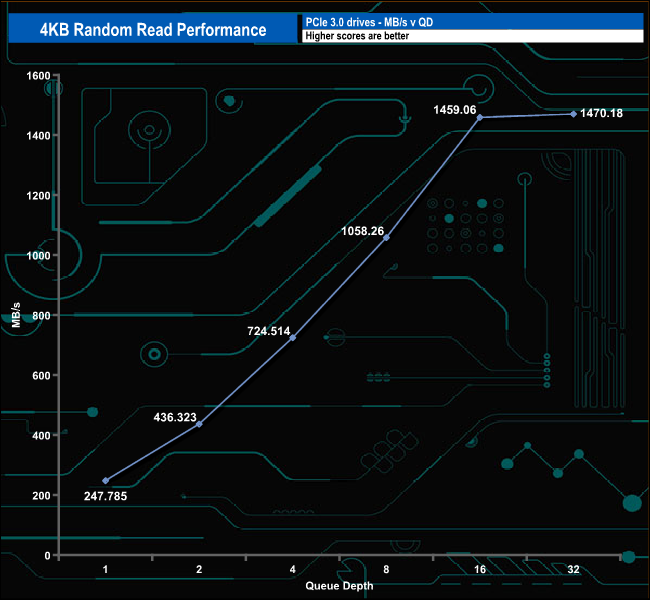
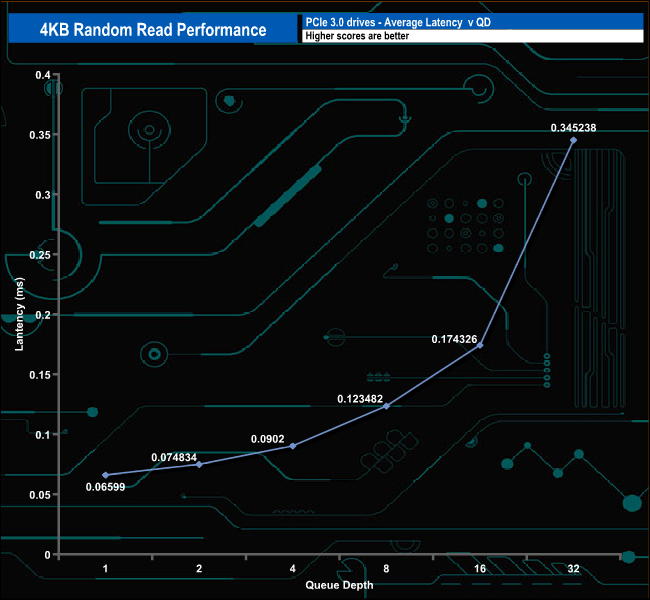
WD rate the 1TB Blue SN570 at up to 460,000 IOPS for 4K random reads. With our 4-threaded test, we were unable to reach this figure, our test producing a maximum of 358,931 IOPS. The drive climbs steadily through the tested queue depths until QD16 where the performance starts to level off; 356,215 IOPS at QD16, 358,931 IOPS at QD32.
4K Random Read v QD Performance compared.
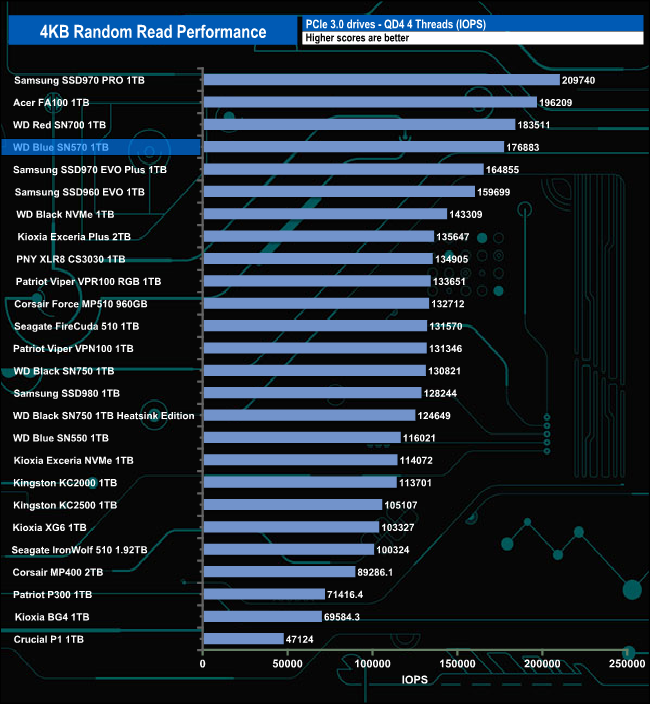
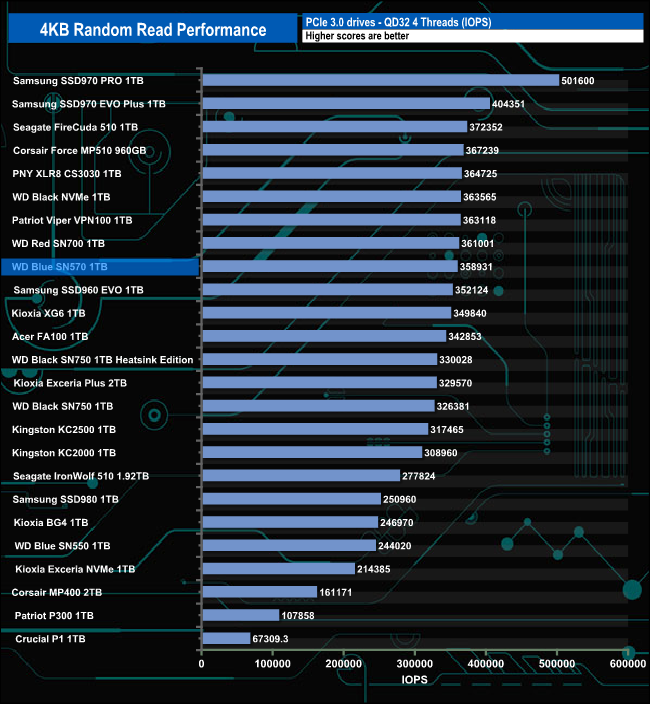
We may not have been able to match WD's maximum 4K random read rating for the drive but it still produces some impressive test results sitting in the top 5 of drives tested until the QD32 mark where it slips down the chart.
We test the 4K random write performance of a drive through a range of queue depths. The setup for the tests is listed below.
4K Random Write
Transfer Request Size: 4KB, Outstanding I/O: 1-32.

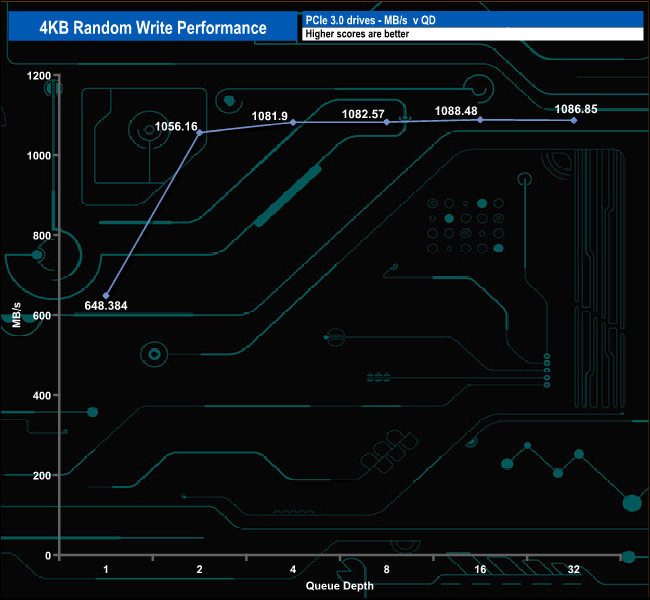
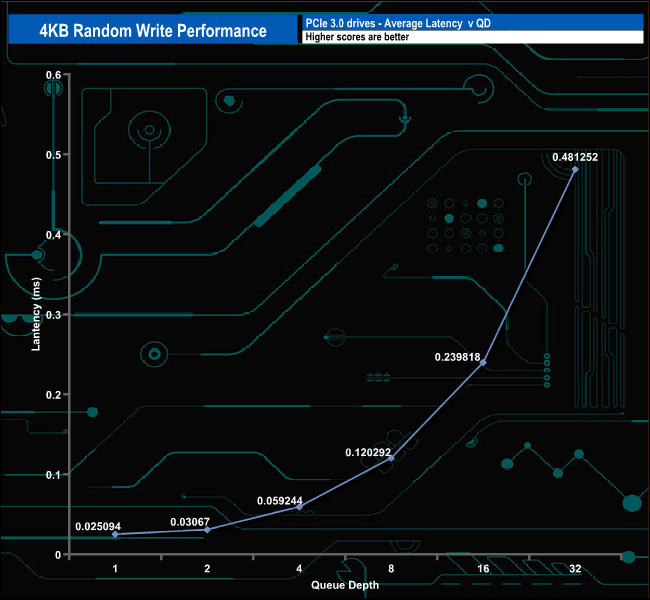
As with the random read testing when it came to random writes our 4-threaded test results were nowhere near the official maximum figure of 450,000 IOPS, the best we saw was 265,743 IOPS at QD16.
4K Random Write v QD Performance compared.
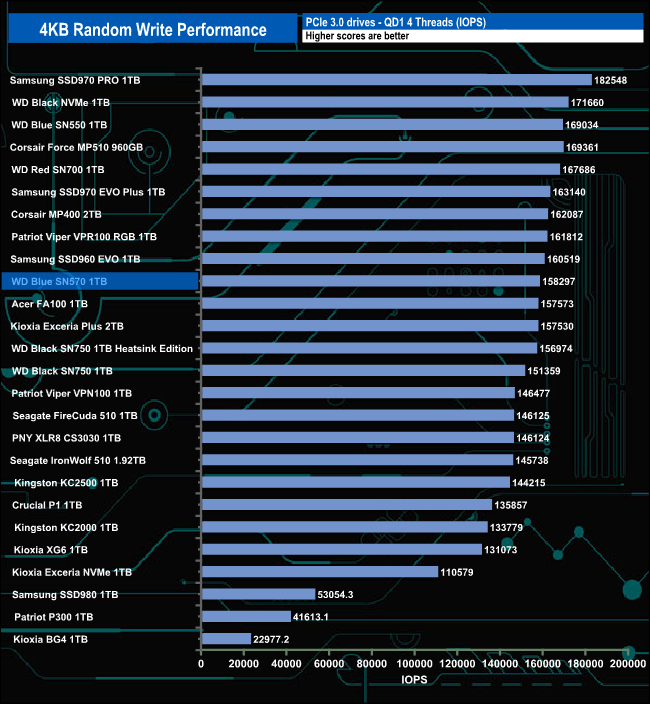
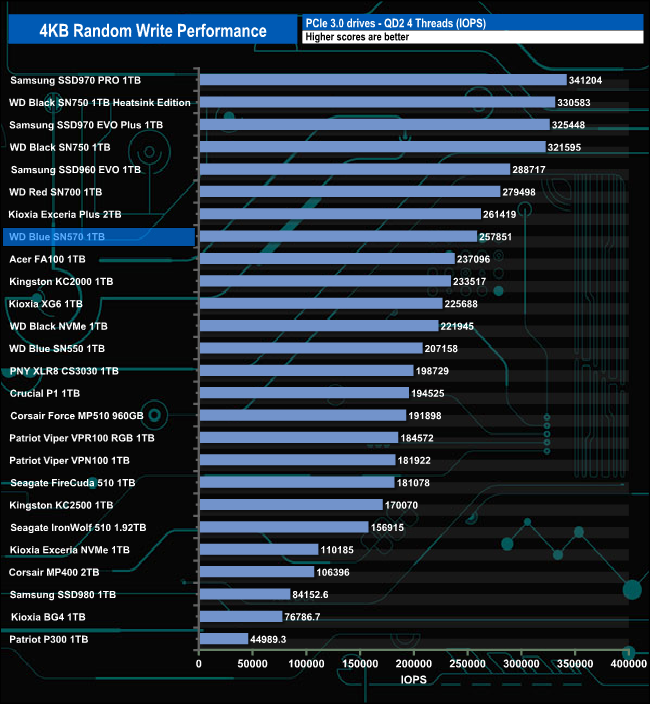
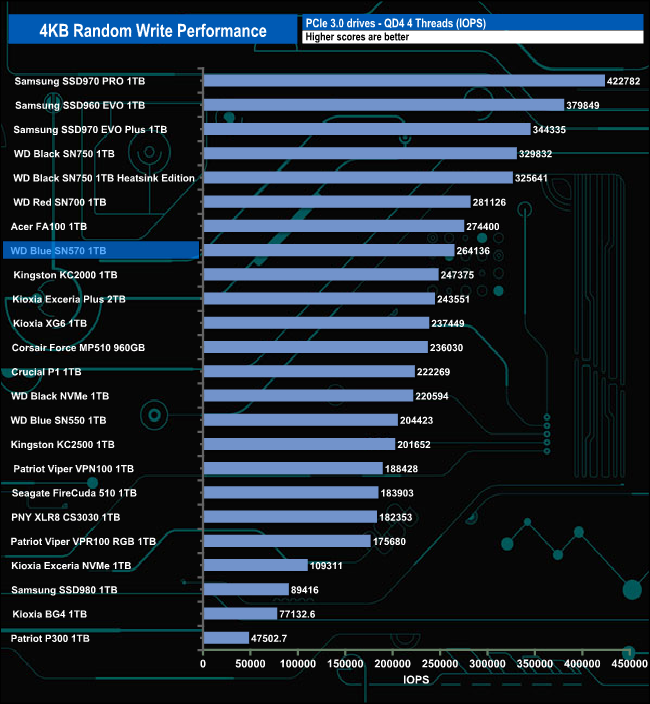
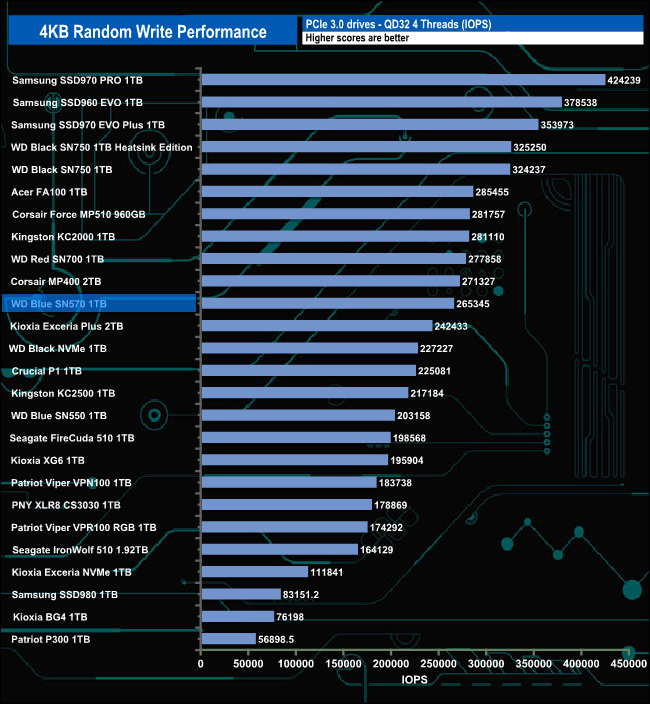
The write performance of the drive is pretty consistent though as the drive sits mid-table throughout the tested queue depths. At all the tested queue depths apart from QD1, the Blue SN570 is faster than the previous Blue SN550.
We test the 4K 70/30 mixed read/write performance of a drive through a range of queue depths.
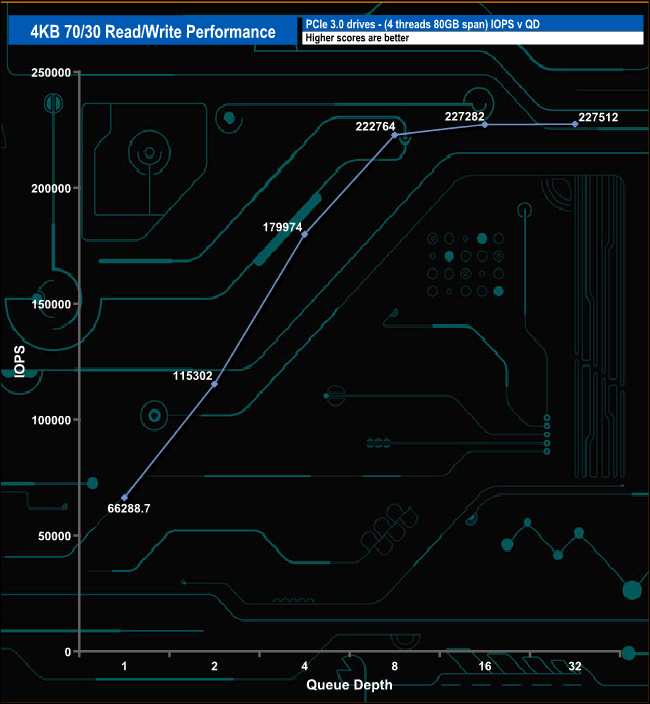
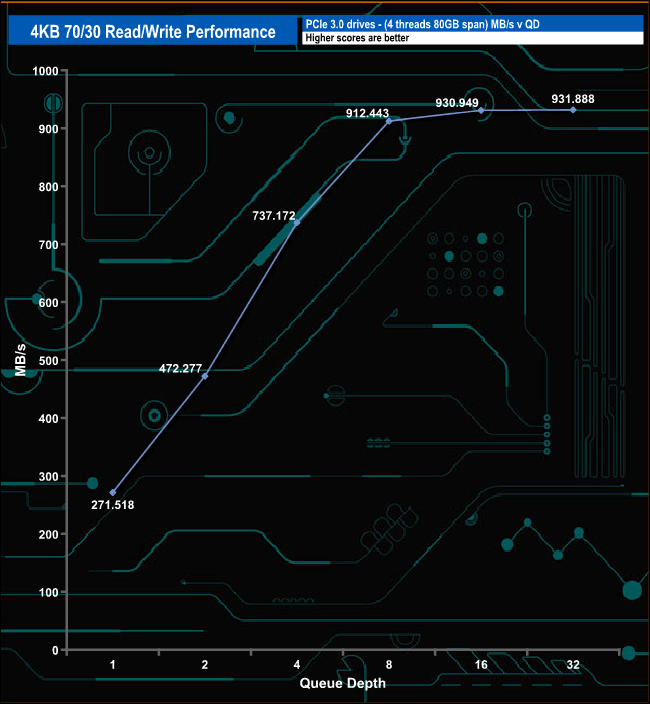
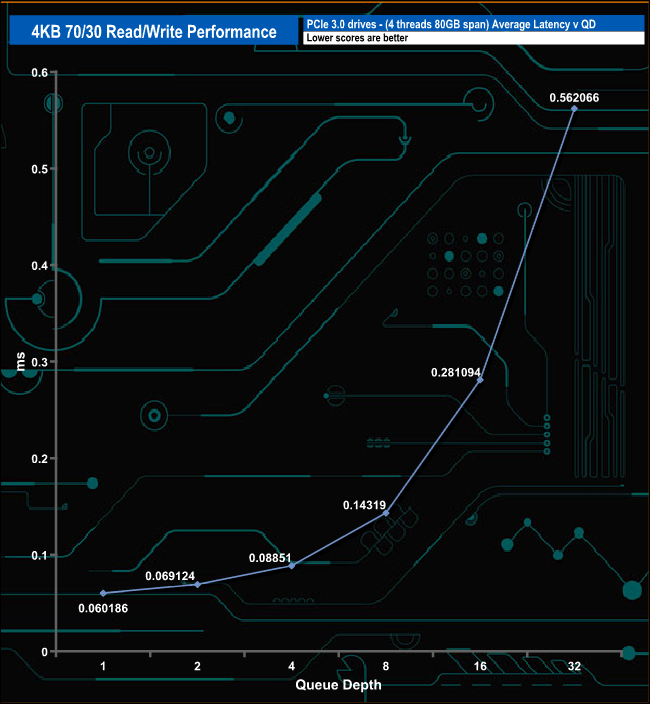
In the 4K 70/30 read/write mixed test the Blue SN570's performance climbs smoothly through the queue depths until QD8, where the performance begins to level off.
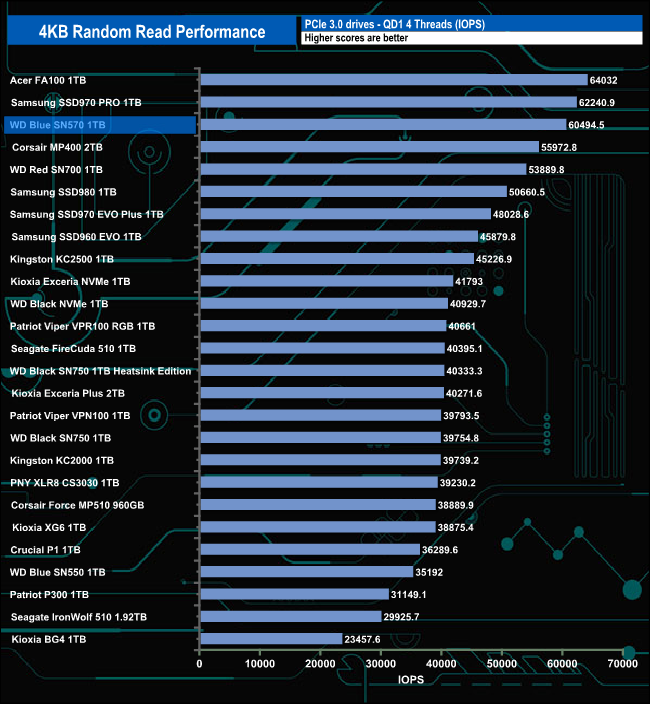
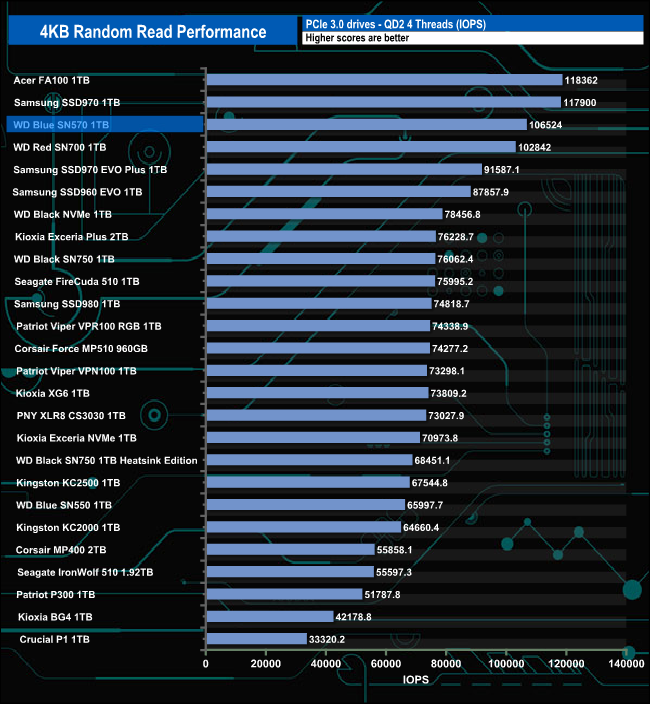
We used CrystalDiskMark 8 to test the random performance of the drive at lower queue depths (QD1 – QD8 where most of the everyday workloads occur) using 1 to 4 threads.
4K Random Read
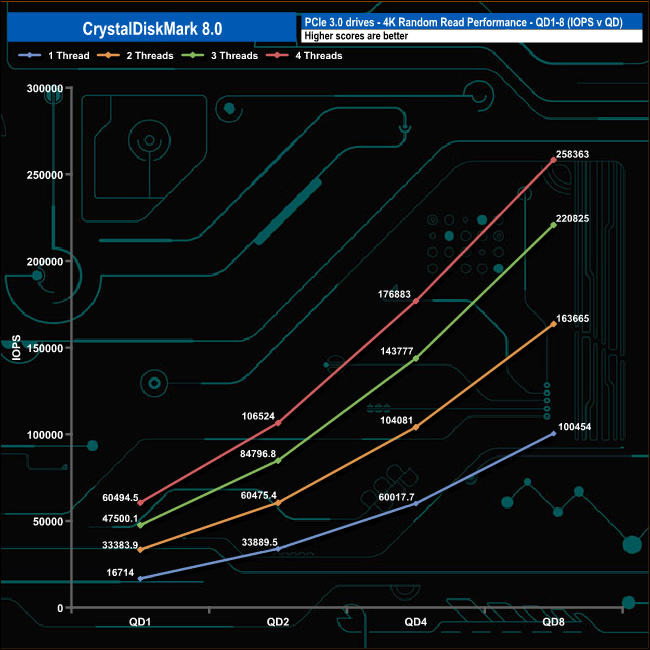
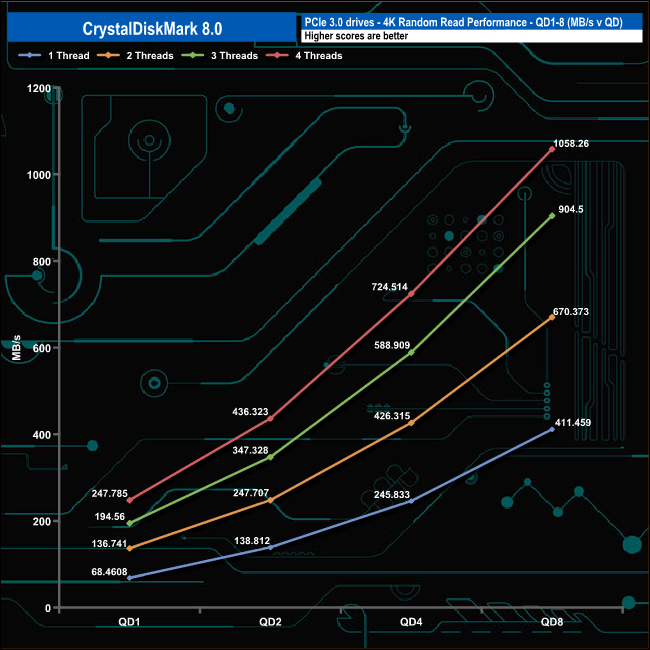
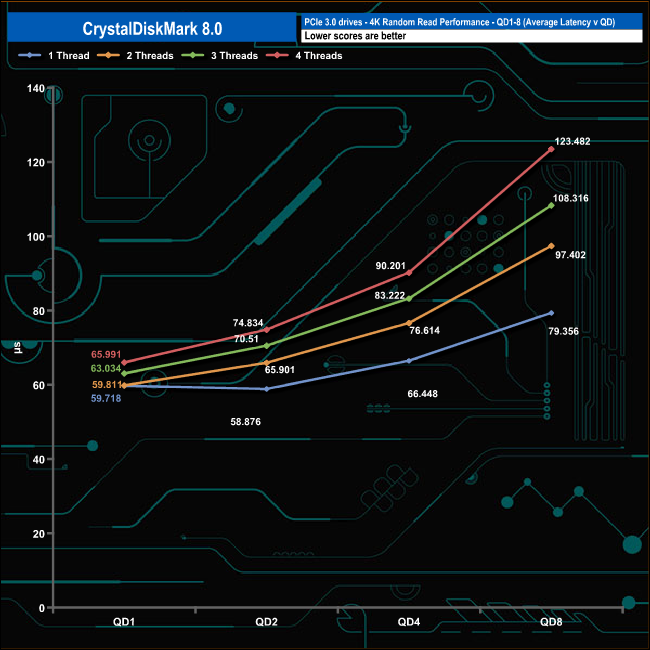
At QD1 the performance of the 1TB WD Blue SN570 ranges from a lowly 16,714 IOPS (68MB/s) using a single thread up to 60,494 IOPS (247MB/s) using four threads. The performance increases steadily as the queue depth deepens for each thread count.
4K Random Write
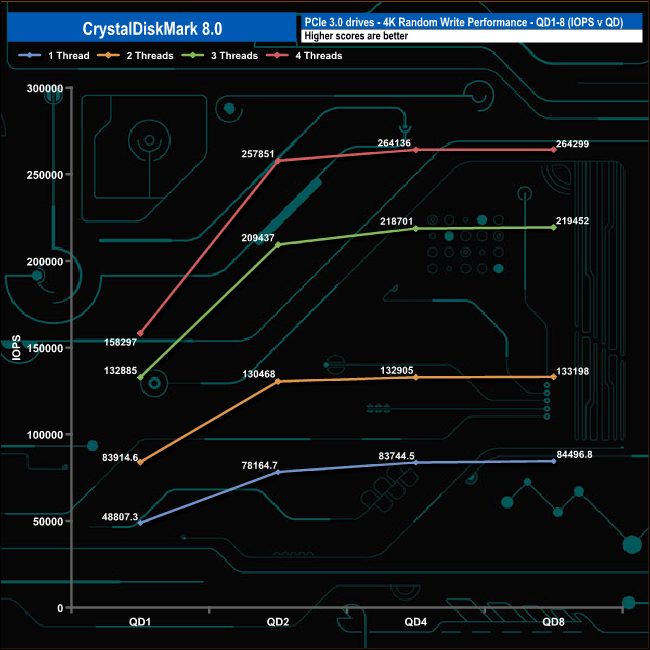
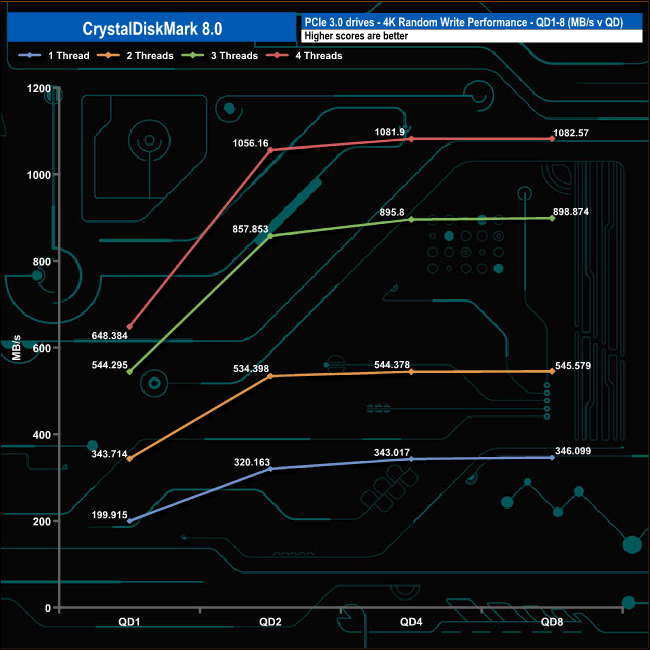
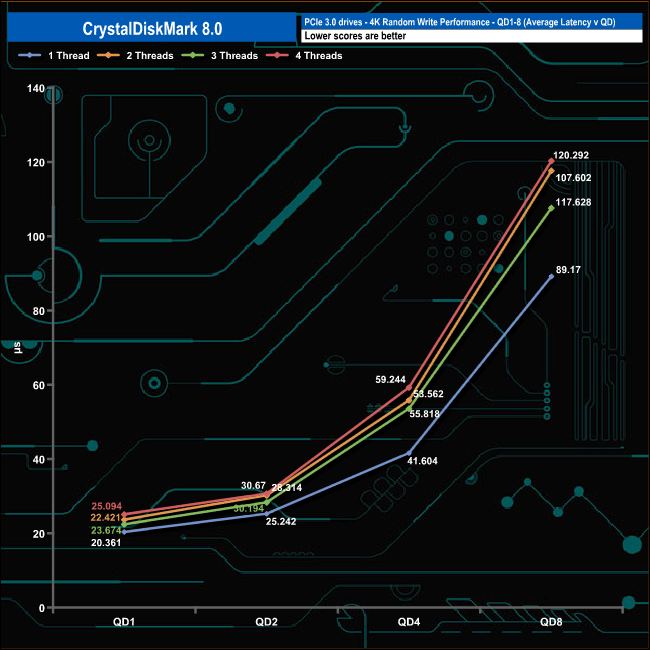
When it comes to random writes, in each tested thread the performance rises sharply between queue depths 1 and 2, particularly the three and four threaded tests before beginning to level out through the rest of the tested queue depths.
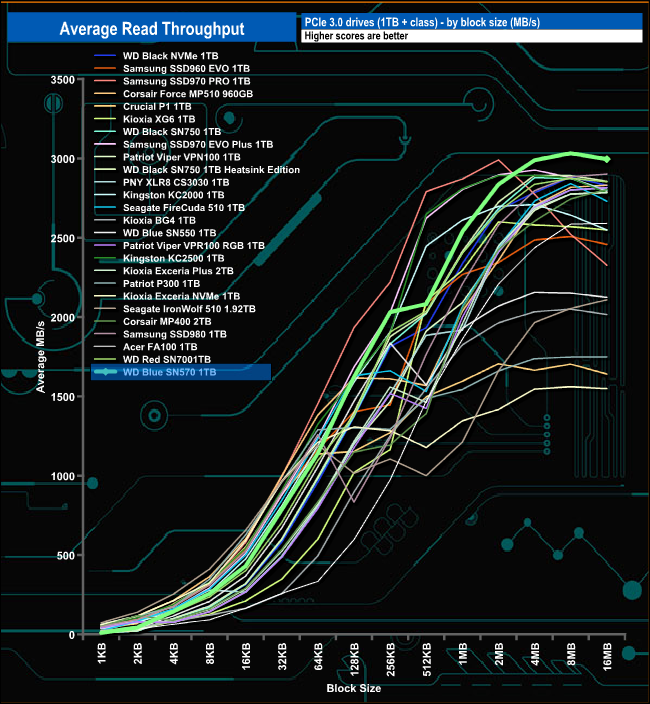

The WD Blue SN750 peaked at the 8MB block mark in our read throughput test with a figure of 3,032.65MB/s, shy of the official maximum of 3,500MB/s. While the peak tested result is short of the official figure, it is the fastest Gen 3 consumer drive when it comes to read throughput we've tested to date.
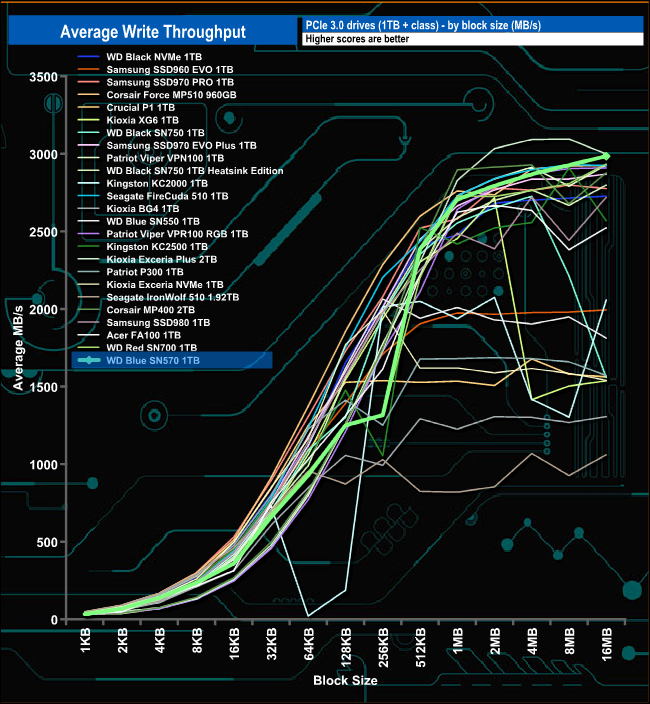
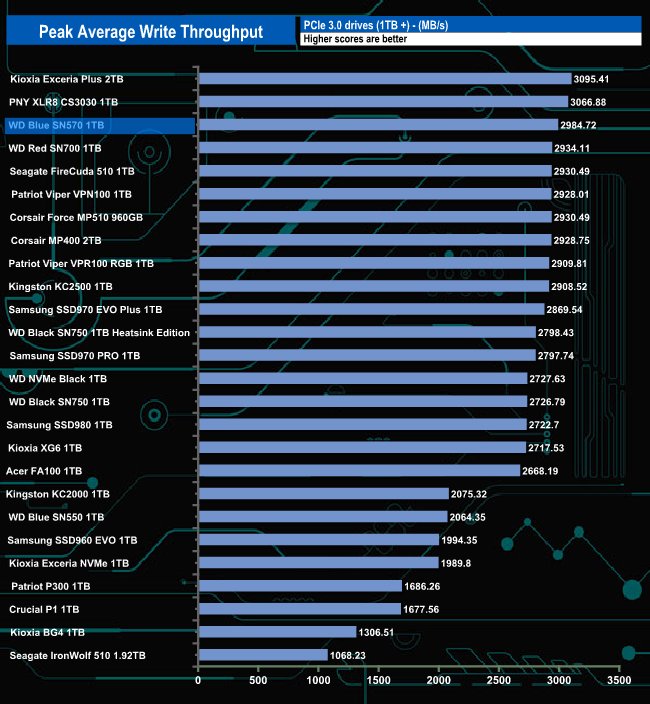
In the write throughput test, the drive peaked at the end of the test (16MB block) at 2,934.11MB/s, just shy of the official maximum of 3,000MB/s. That test result sees the drive sitting in third place in our result charts. In this test, the 1TB WD Blue SN570 is some 920.37MB/s faster than the previous WD Blue drive, the SN550.
The PCMark 10 Full System Drive Benchmark uses a wide-ranging set of real-world traces from popular applications and common tasks to fully test the performance of the fastest modern drives. The benchmark is designed to measure the performance of fast system drives using the SATA bus at the low end and devices connected via PCI Express at the high end.
The goal of the benchmark is to show meaningful real-world performance differences between fast storage technologies such as SATA, NVMe, and Intel’s Optane. The Full System Drive Benchmark uses 23 traces, running 3 passes with each trace. It typically takes an hour to run.
Traces used:
Booting Windows 10.
Adobe Acrobat – starting the application until usable.
Adobe Illustrator – starting the application until usable Adobe Premiere Pro – starting the application until usable.
Adobe Photoshop – starting the application until usable.
Battlefield V – starting the game until the main menu.
Call of Duty Black Ops 4 – starting the game until the main menu.
Overwatch – starting the game until main menu.
Using Adobe After Effects.
Using Microsoft Excel.
Using Adobe Illustrator.
Using Adobe InDesign.
Using Microsoft PowerPoint.
Using Adobe Photoshop (heavy use).
Using Adobe Photoshop (light use).
cp1 Copying 4 ISO image files, 20 GB in total, from a secondary drive to the target drive (write test).
cp2 Making a copy of the ISO files (read-write test).
cp3 Copying the ISO to a secondary drive (read test).
cps1Copying 339 JPEG files, 2.37 GB in total, to the target drive (write test).
cps2 Making a copy of the JPEG files (read-write test).
cps3 Copying the JPEG files to another drive (read test).
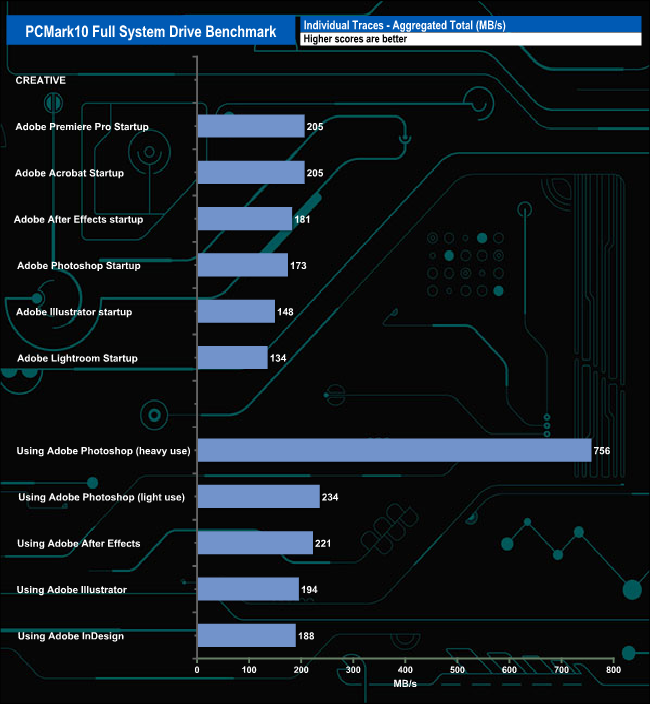
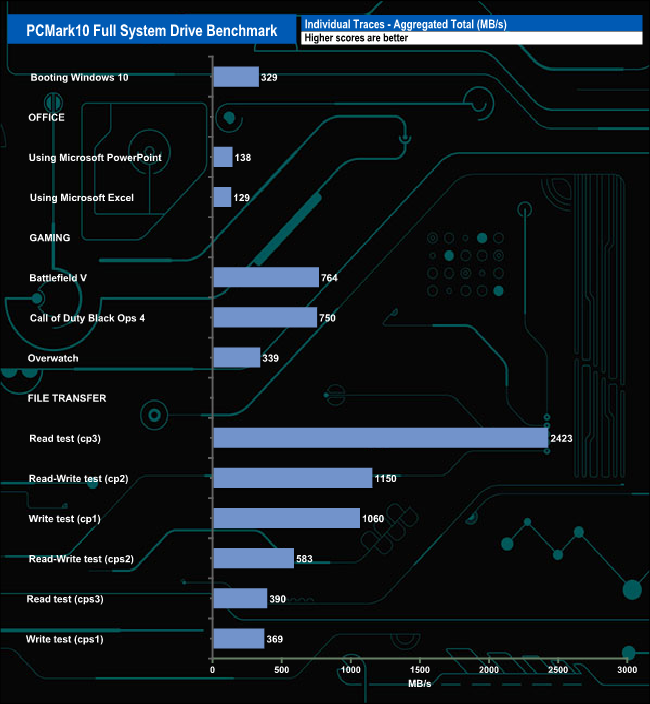
The WD Blue SN570 dealt with the rigours of the PCMark10’s Full System Drive pretty well. The best result from the Creative set of test traces was the 756MB/s for the Heavy Use Adobe Photoshop trace. The file transfer tests also produced a very good cp3 (read test) figure of 2,423MB/s backed up by 1,150MB/s for the cp2 read/write test and 1,060MB/s for the cp1 write test.
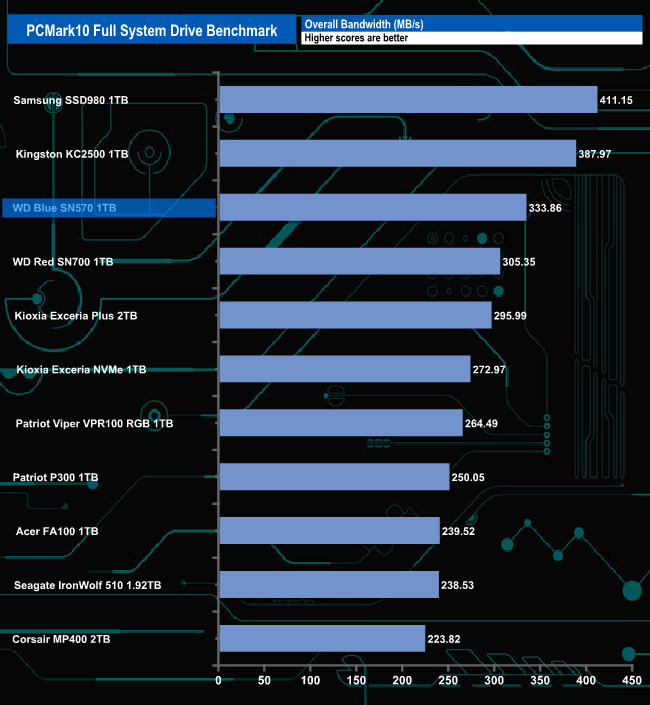
The overall bandwidth figure of 333.86MB/s sees the WD Blue SN570 in third place in our result chart behind Samsung's SSD980 and Kingston's KC2500.
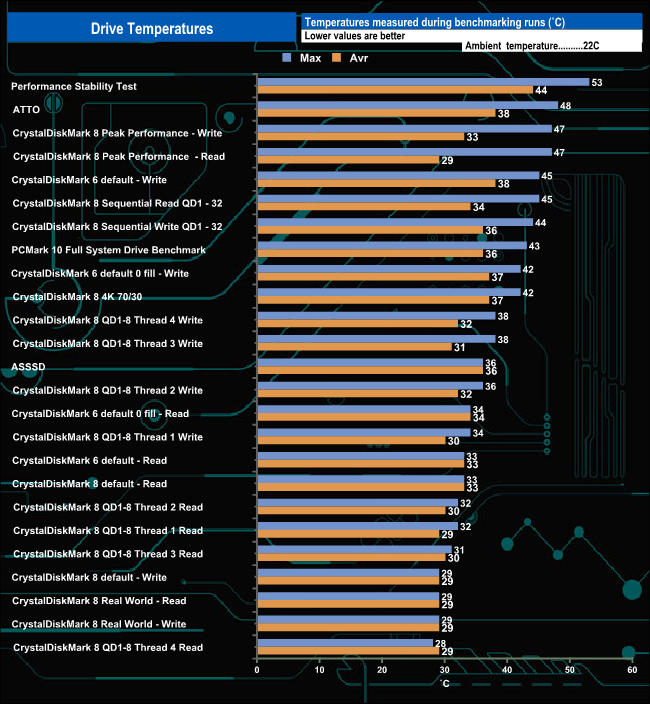
We took note of the drive’s temperature during some of our benchmarking runs. The WD Blue SN570 doesn’t have a heatsink, but there is plenty of empty space on the PCB to allow air circulation around the components. The hottest the drive got was when it was being pushed very hard during the Performance Stability test run when it peaked at 53° C.
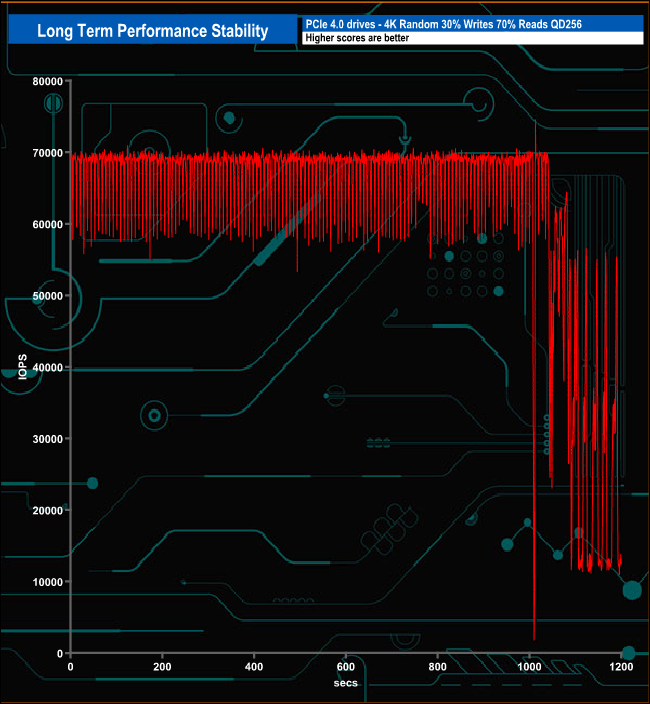
For the long term performance stability test, we set the drive up to run a 20-minute 4K random test with a 30% write, 70% read split, at a Queue Depth of 256 over the entire disk. The 1TB WD Blue SN570 averaged 63,220 IOPS for the test with a first-rate performance stability of 89%.
To test the real-life performance of a drive we use a mix of folder/file types and by using the FastCopy utility (which gives a time as well as MB/s result) we record the performance of drive reading from & writing to a 256GB Samsung SSD850 PRO.
We use the following folder/file types:
- 100GB data file.
- 60GB iso image.
- 60GB Steam folder – 29,521 files.
- 50GB File folder – 28,523 files.
- 21GB 8K Movie demos.
- 12GB Movie folder – 24 files (mix of Blu-ray and 4K files).
- 11GB 4K Raw Movie Clips (8 MP4V files).
- 10GB Photo folder – 621 files (mix of png, raw and jpeg images).
- 10GB Audio folder – 1,483 files (mix of mp3 and .flac files).
- 5GB (1.5bn pixel) photo.
- Blu-ray movie.
![]()
![]()
The WD Blue SN570 handled our real-life file testing without displaying any problems averaging 513MB/s writing the larger test files to the drive and 441MB/s when reading the data back again.
To get a measure of how much faster PCIe NVMe drives are than standard SATA SSD's we use the same files but transfer to and from a 2TB Kioxia Exceria Plus drive:
![]()
![]()
Switching over to an all NVMe storage environment we see write speeds averaging 2,422MB/s for the six largest folder transfers, the fastest being the 2,645MB/s when writing the 5GB image.
WD has been busy of late. First we had the latest addition to the NAS-focussed Red product line, in the shape of the SN700, and now we have the newest member of the mainstream Blue family, the SN570.
The third generation WD Blue SN570 takes over from the SN550 as being the fastest Blue drive currently available. The new drive uses an in-house WD controller and 3D TLC NAND, but WD is keeping details of both very close to their chest – but it seems reasonable to surmise that the NAND used by the drive is the latest 112-layer BiCS5 flash especially given the performance advantage the SN570 has over the SN550.
As with the SN550 line-up at launch, at the time of writing the SN570 product line consists of just three capacities; 250GB, 500GB and 1TB (the drive we are looking at here).
Official Sequential ratings for the 1TB drive are up to 3,500MB/s for reads with writes at up to 3,000MB/s. Those figures are 1,100MB/s and 1,050MB/s faster for read and writes respectively than the previous 1TB SN550. When benchmarked with the ATTO benchmark we couldn't quite hit the official maximum, the drive producing a figure of 3,380MB/s… but we could confirm the official write figure with a test result of 3,050MB/s. However, with CrystalDiskMark we could confirm both figures.
When it comes to 4K random performance WD quote figures of up to 460,000 IOPS and up to 450,000 IOPS for read and writes respectively. As with the Sequential performance, these are a marked improvement over the 1TB SN550's figures of up 345,000 IOPS for reads and up to 385,000 IOPS for writes. With our standard 4-threaded tests we saw a best of 358,931 IOPS (QD32) for reads and 265,743 IOPS for writes at QD16. However, using the Peak Performance profile in CrystalDiskMark 8 we could confirm the official read figure with a test result of 466,033 IOPS, but it still came up a little shy of the official maximum write figure at 444,940 IOPS.
Although the performance of the SN570 shows a big improvement over the SN550, the SN570's endurance is rated the same as the older drive; 600TBW for the 1TB model, 300TBW for the 500GB and 150TBW for the entry 250GB drive.
The 1TB Blue SN570 we reviewed today is priced at £91.99 direct from WD HERE.
Pros
- Overall performance.
- 5-year warranty.
Cons
- Couldn’t match the official maximum 4K random write figures with some of our testing.
KitGuru says: WD’s SN570 Blue shows a marked increase in performance over the previous Blue SN550 thanks to the NAND technology it uses and controller updates, while WD has given it every chance with a pretty competitive price tag.