
The latest addition to WD's Black performance/gaming range is the AN1500, an AIC (add-in card) drive using two NVMe SSD drives built into a RAID 0 array together with a PCIe Gen 3.0 x8 interface and customisable RGB lighting.
WD's Black AN1500 comes in three capacities; 1TB, 2TB (the drive we are reviewing here) and the flagship 4TB model. Internally the AN1500 uses a pair of WD PC SN730 NVMe SSDs built-in a RAID 0 array, the hardware array is controlled by a Marvell 88NR2241 IC.
Officially all three drives have same the same Sequential read/write figures of up to 6,500MB/s and 4,100MB/s respectively. Random 4K performance is stated as up to 760,000 IOPs for reads and up to 690,000 IOPS writes for the 1TB drive, the 2TB and 4TB drive have an up to 780,000 IOPS rating for reads with writes at up to 700,000 IOPS for the 2TB model and up to 710,000 IOPS for the 4TB drive.
Power consumption is stated as up to 15.7W active for reads and up to 12.8W for writes with an 8.5W figure when the drive is idle.
There are no endurance figures for the AN1500 on the spec sheet but the 1TB model of the SN730 drive that is inside it has a rating of 400TBW. WD back the AN1500 with a 5-year warranty.
Physical Specifications:
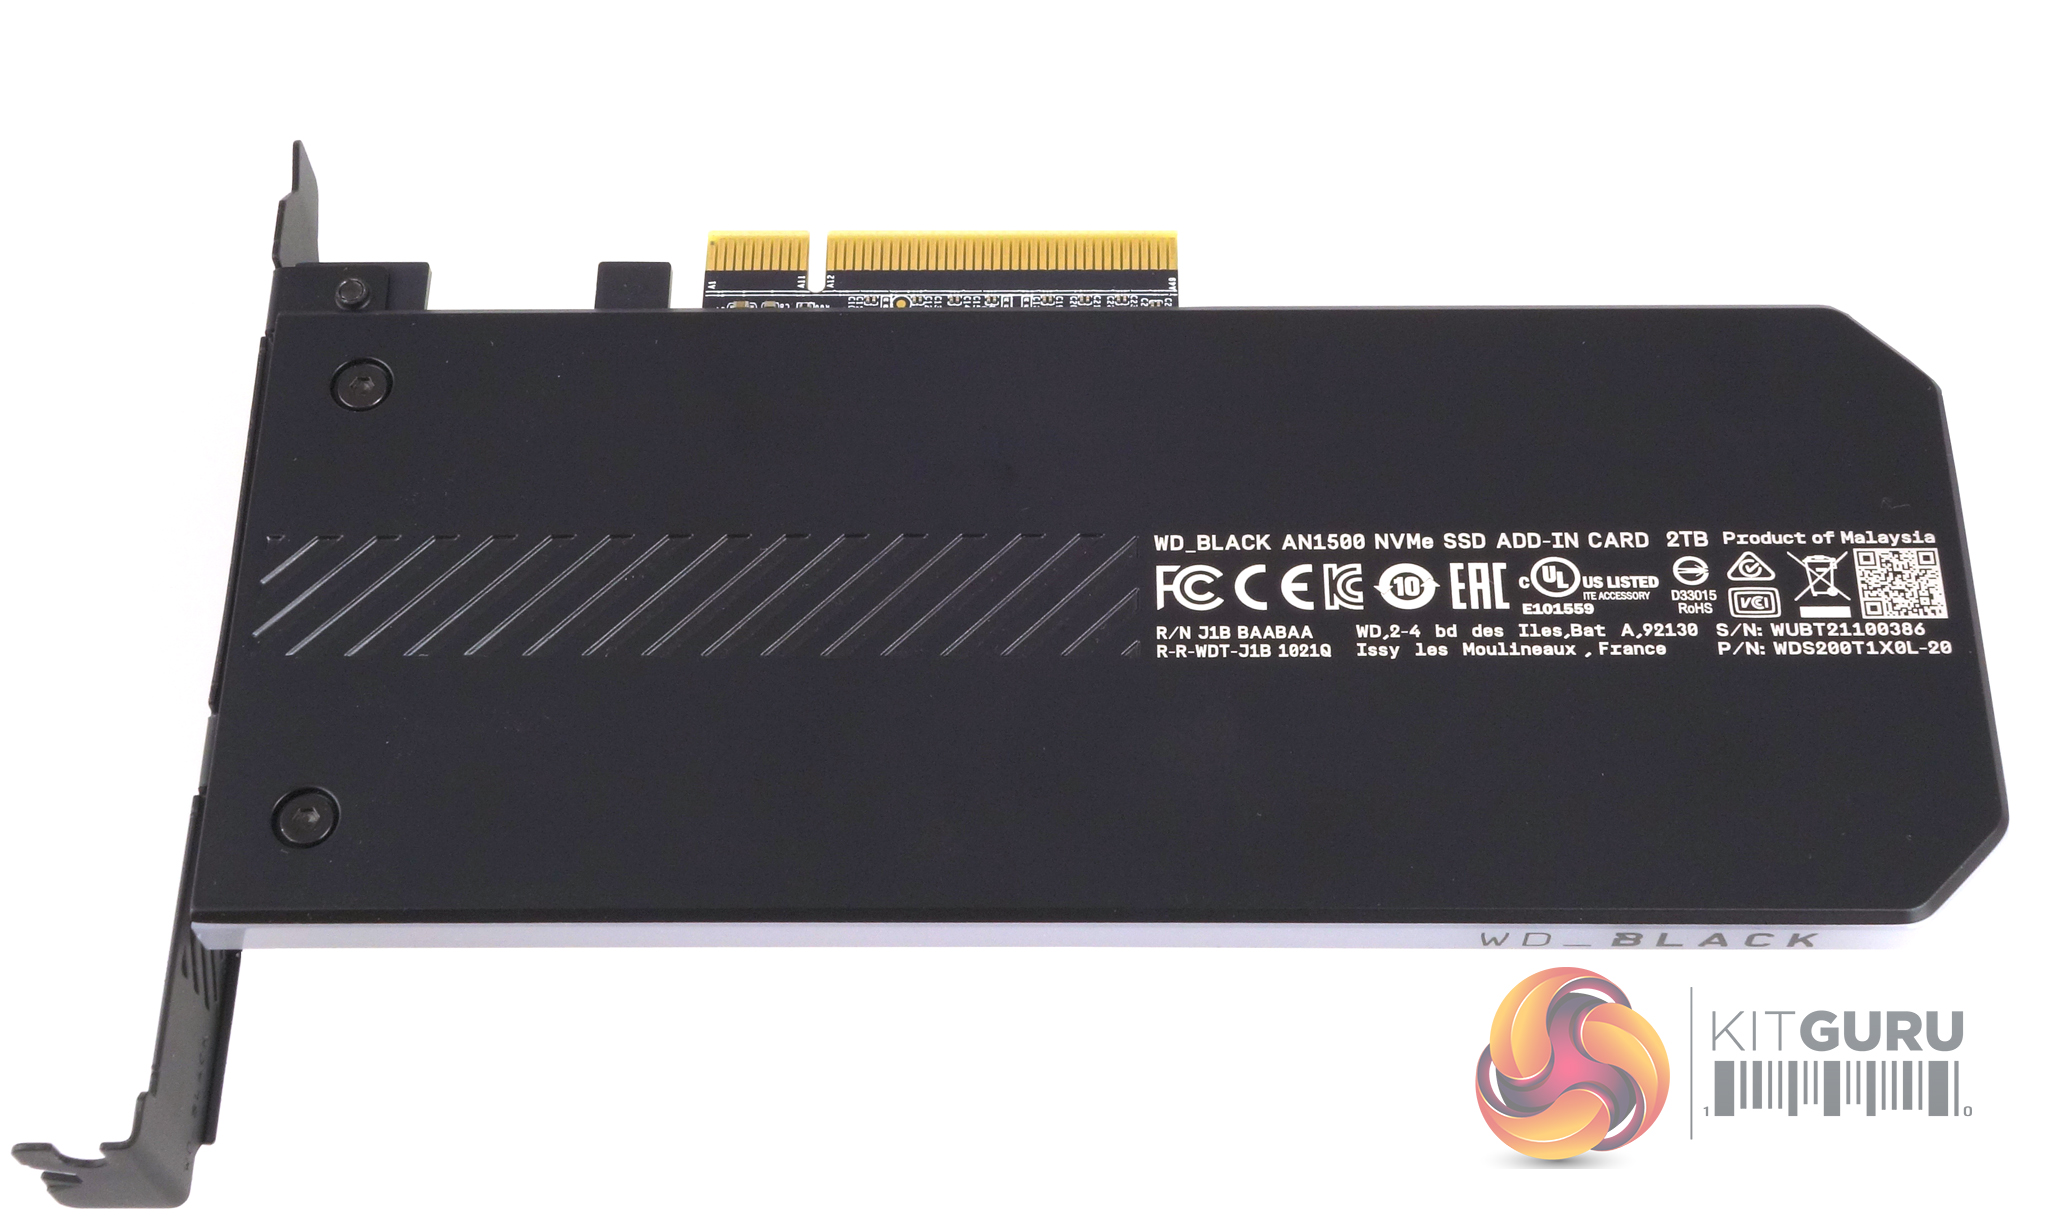
Usable Capacities: 2TB.
NAND Components: SanDisk 96-Layer 3D TLC.
NAND Controller: 2 x WD in-house.
RAID Controller: Marvell 88NR2241-BWW2.
Interface: PCIe Gen3.0 x8.
Form Factor: HHHL (Half-Height, Half Length) AIC (Add-in-card).
Dimensions: 13 x 72 x 176mm.
Drive Weight: 210g.
Firmware Version: 10271043.
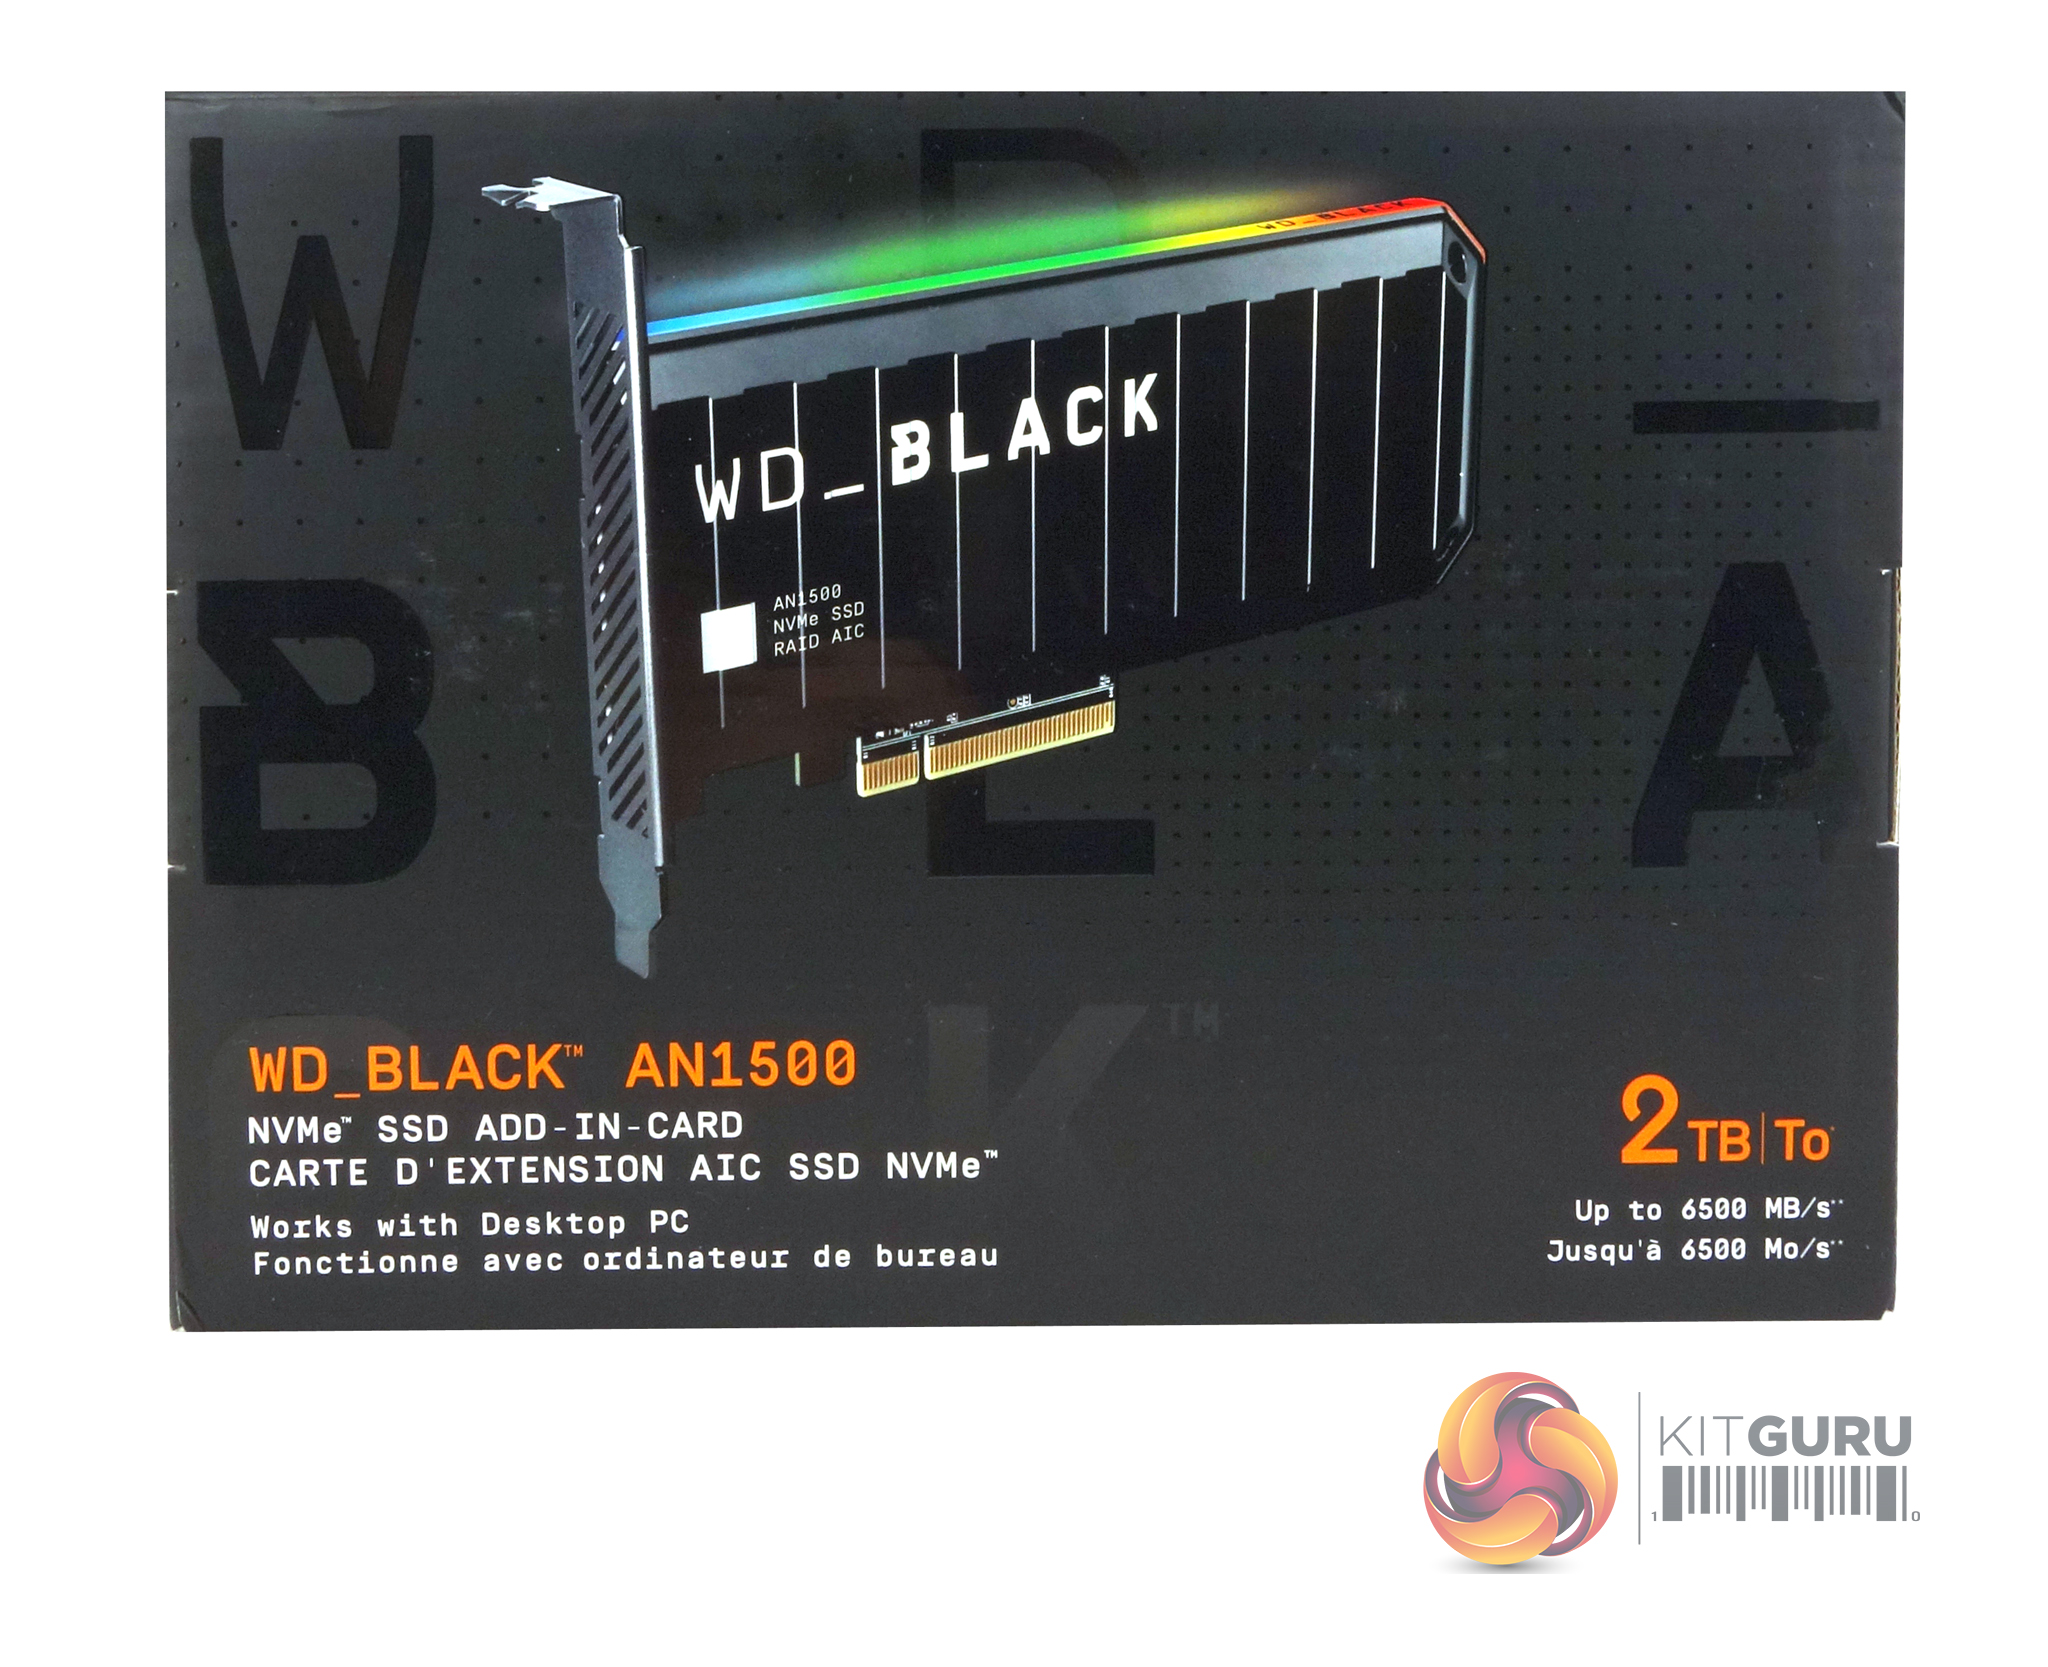
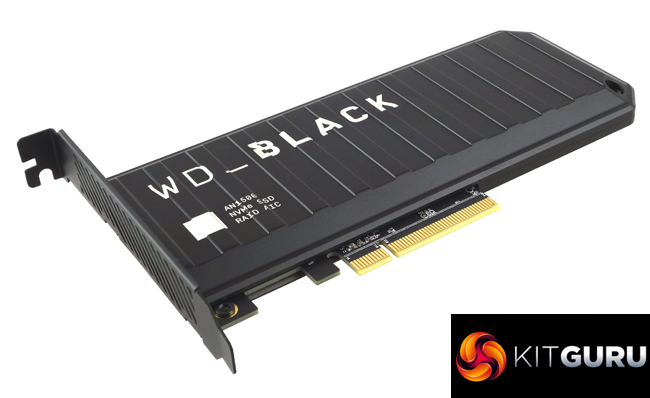
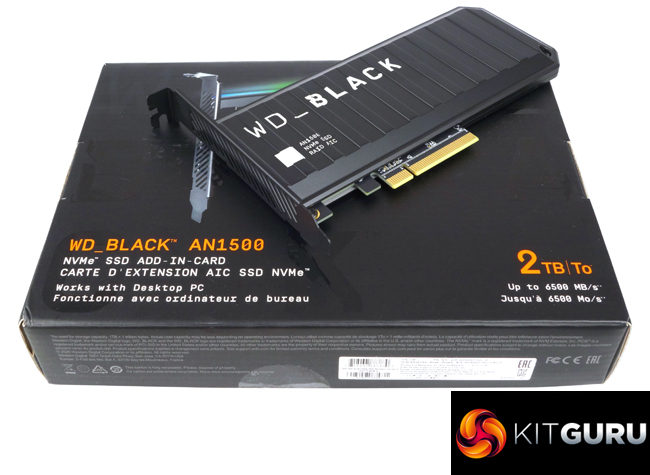
The AN1500 comes in a stout box with an image of the drive on the front. Under the image to the left are the name and the fact it is an NVMe SSD add-in-card and it works in a desktop PC. This information is repeated in French. To the right is the drives capacity and the sequential speed rating, again this information is repeated in French.
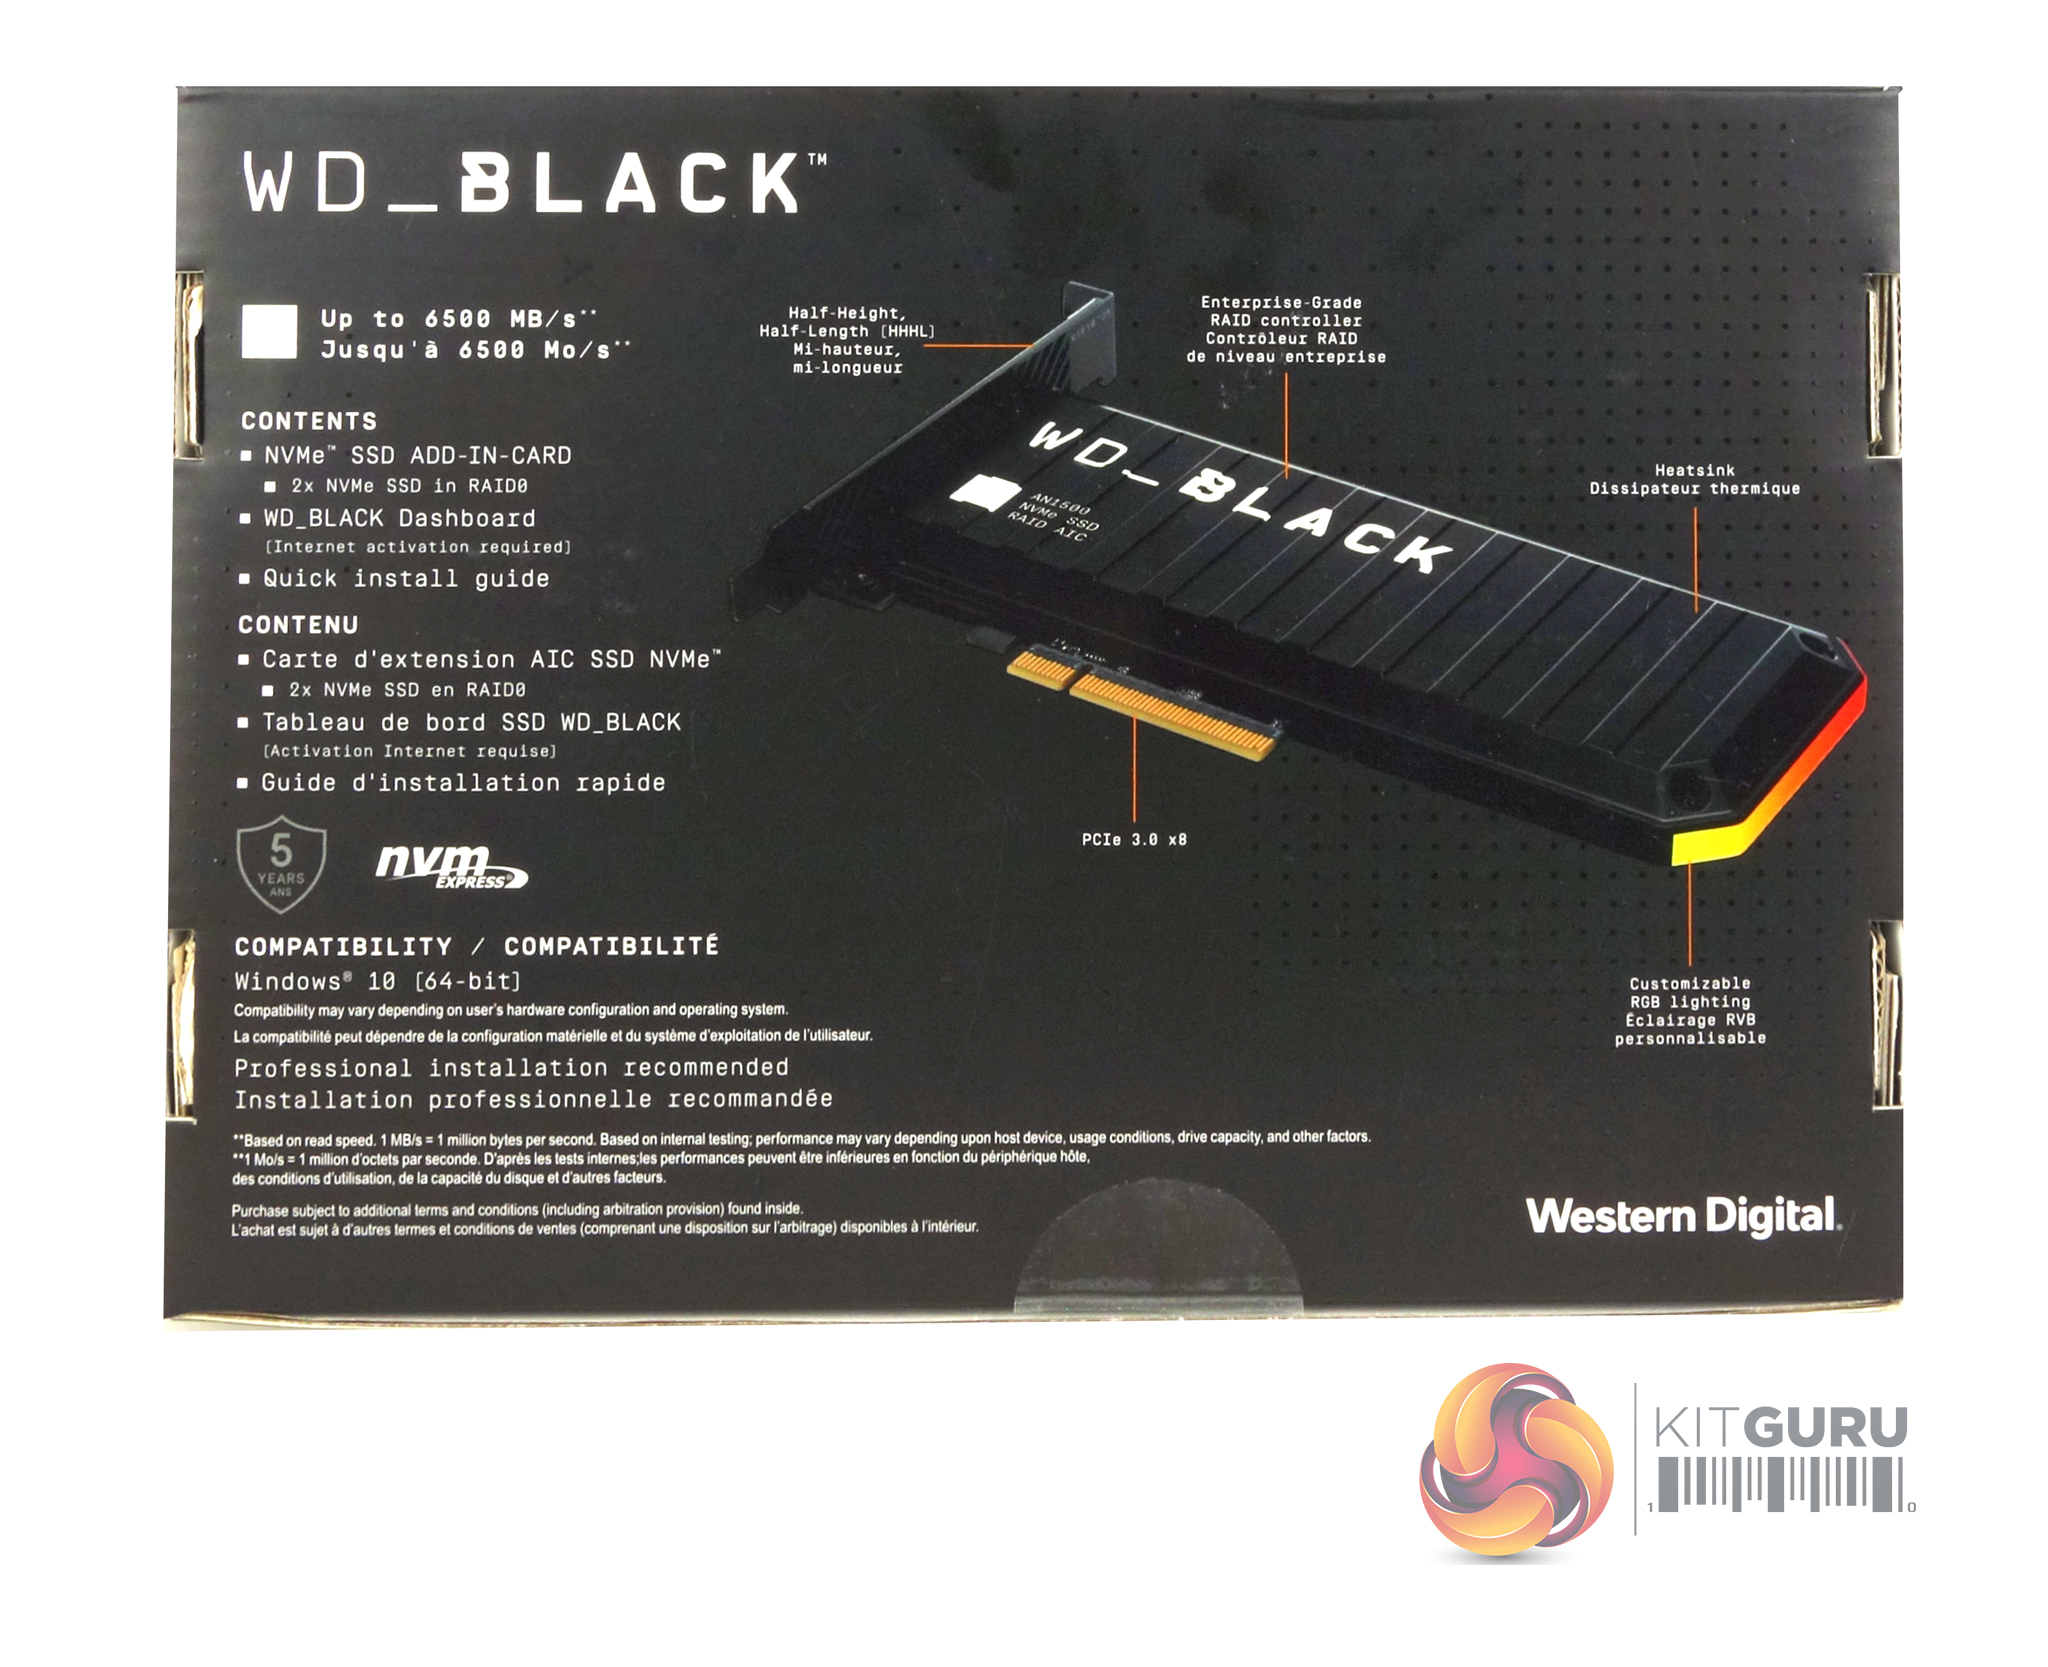
The rear of the box has another image of the drive from a different angle. Some of the drives features are labelled on the image and to the side is a box contents list. As with the front of the box, everything is repeated in French.
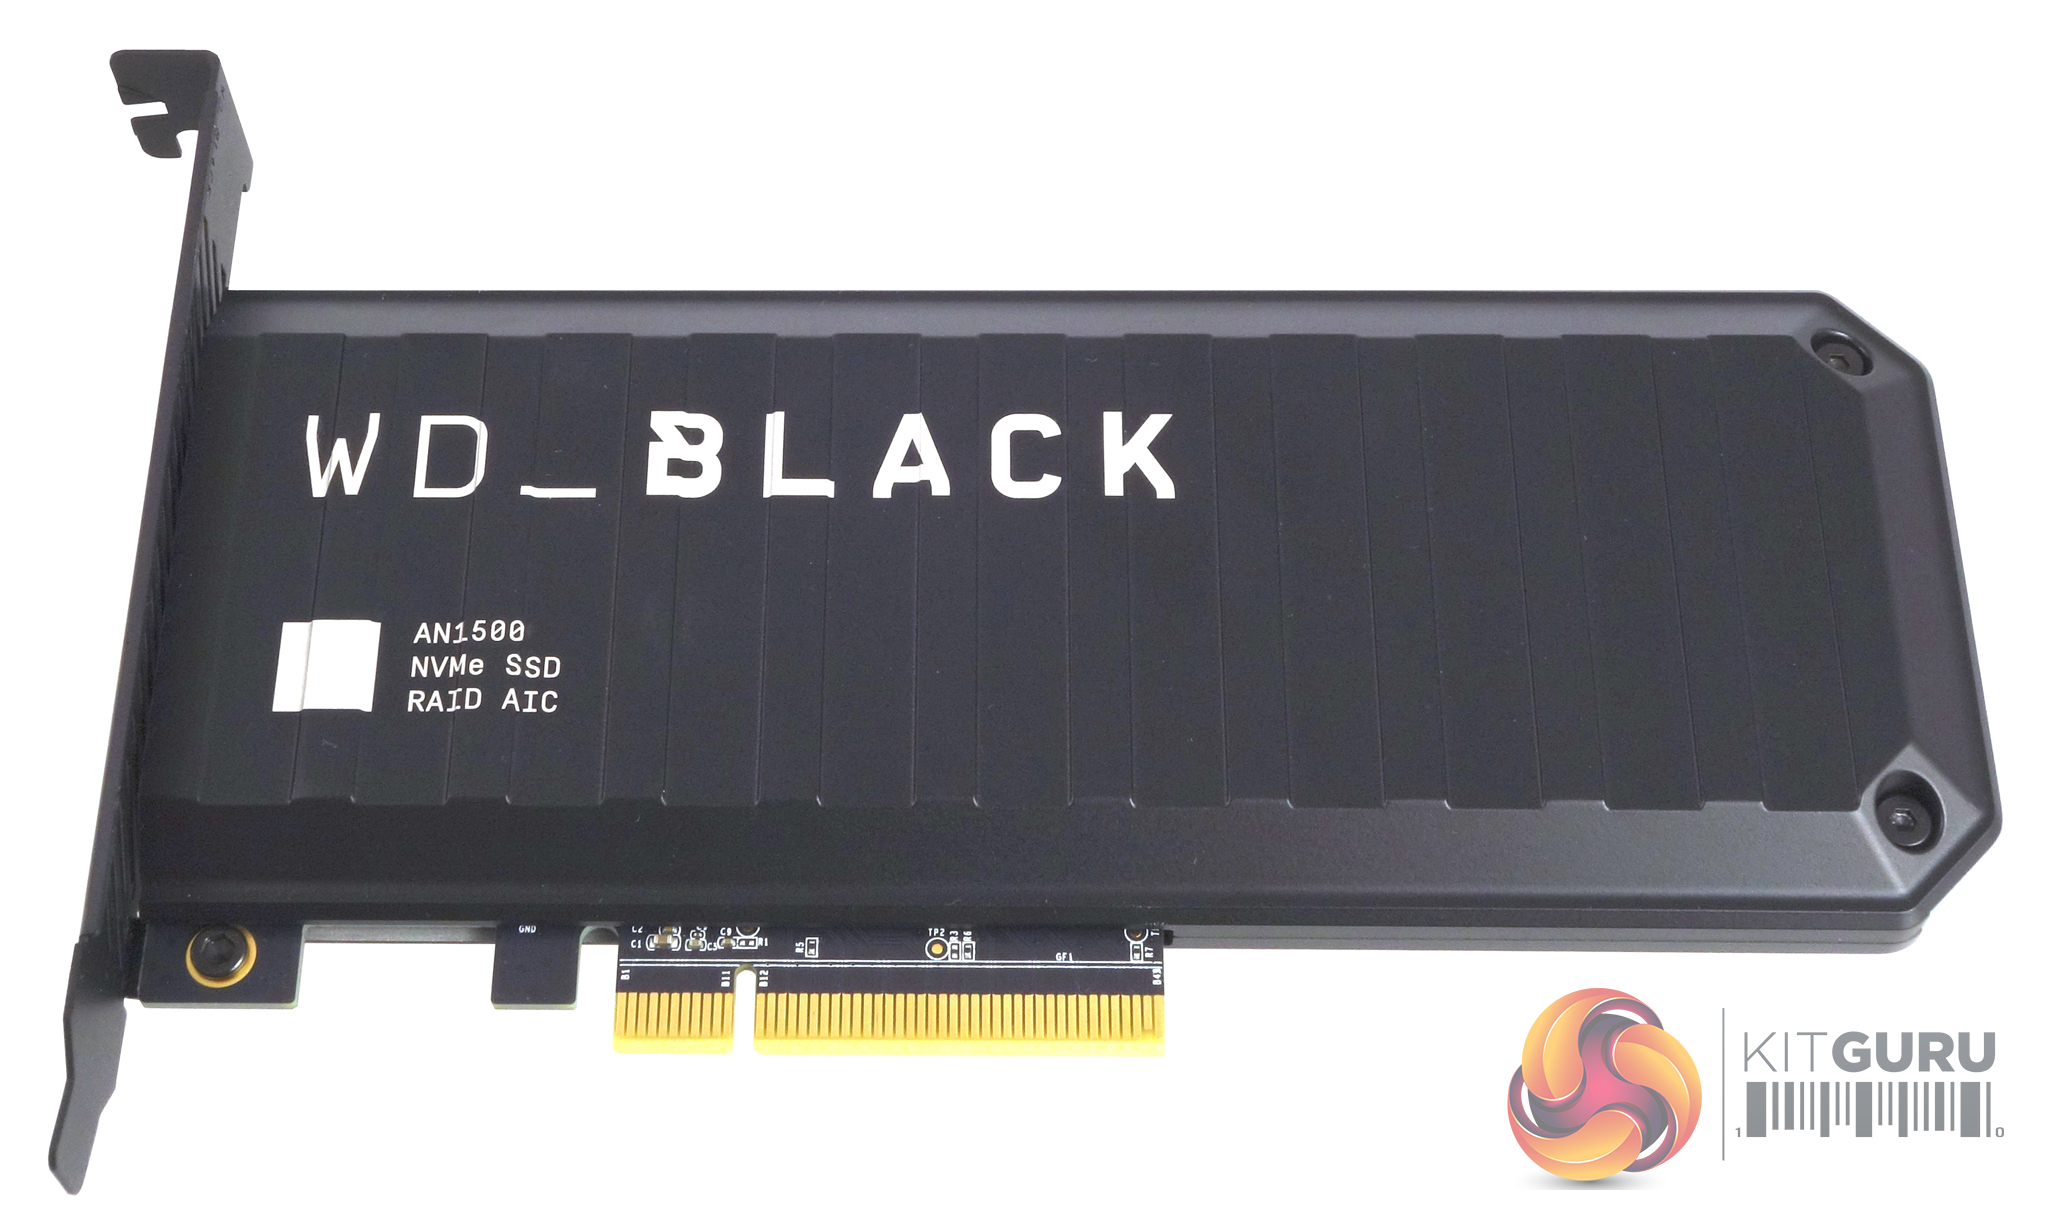
WD's AN1500 is built on an HHHL (Half-Height, Half-Length) AIC (Add-in-card) format. Both side covers of the drive are made from aluminium which act as heatsinks which are needed considering there are two fast SSDs together with a RAID controller lurking on the PCB so it's going to get a little toasty. Internally the AN1500 uses a pair of WD's PC SN730 NVMe SSDs which are built-in a RAID 0 array controlled by a Marvell 88NR2241 IC.
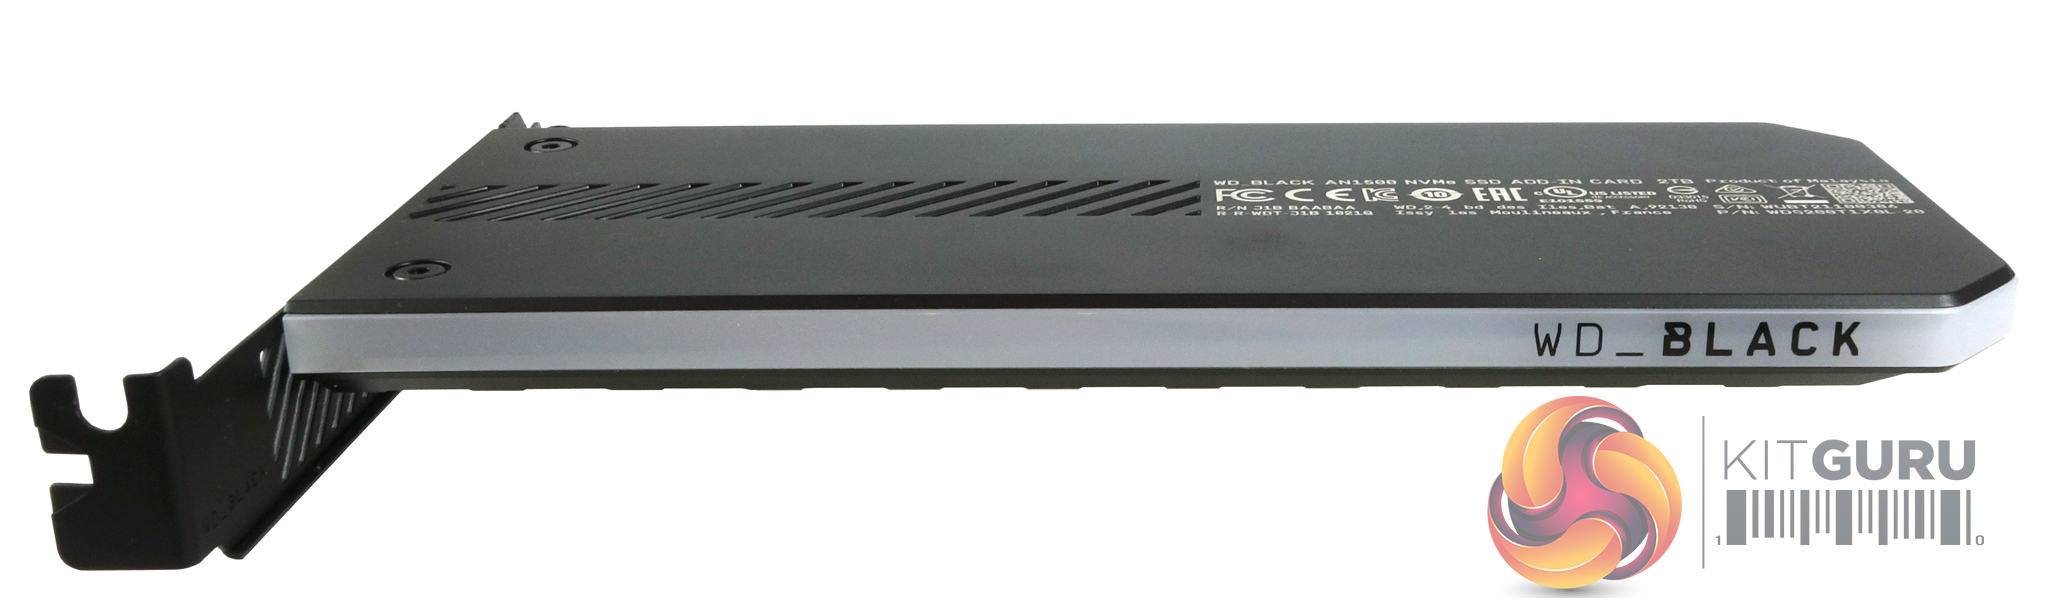
The RGB lighting system uses 16 LEDs which have a diffused cover on the top edge of the drive.
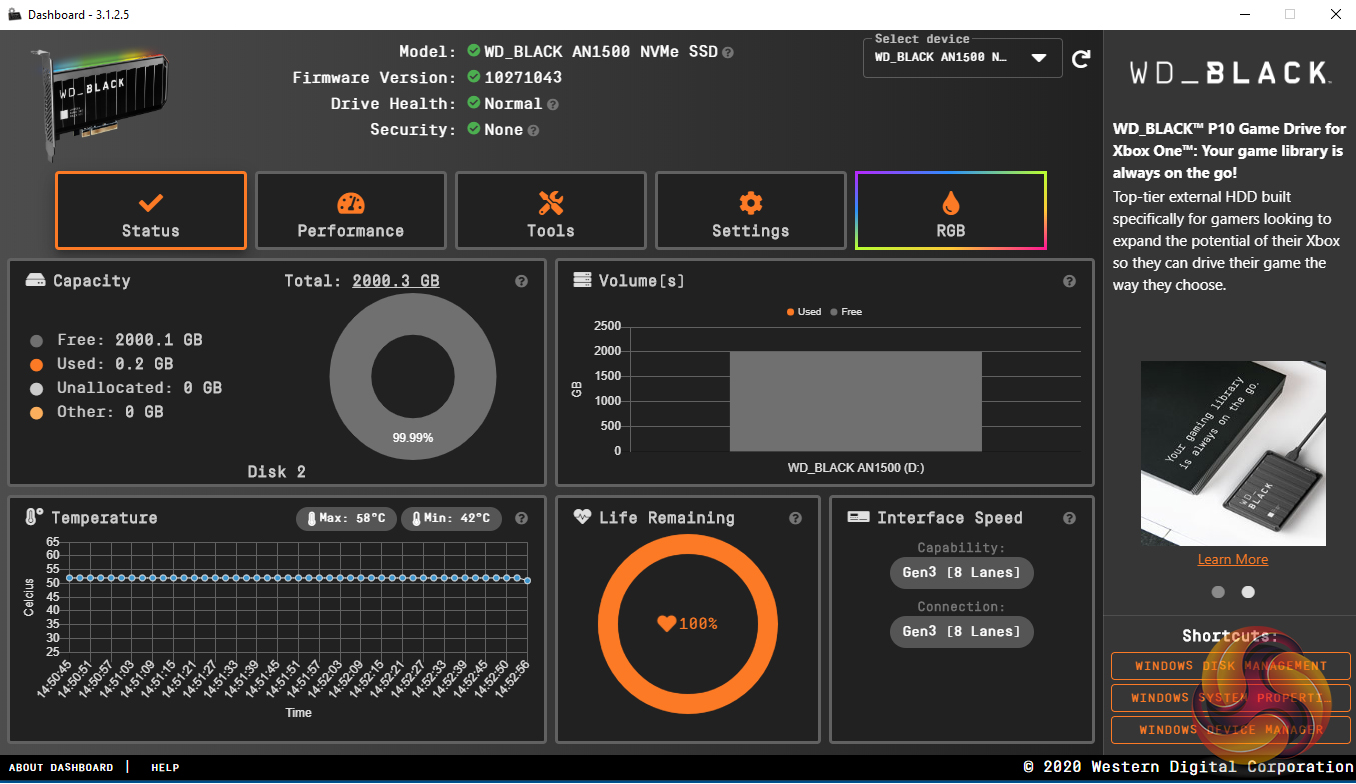
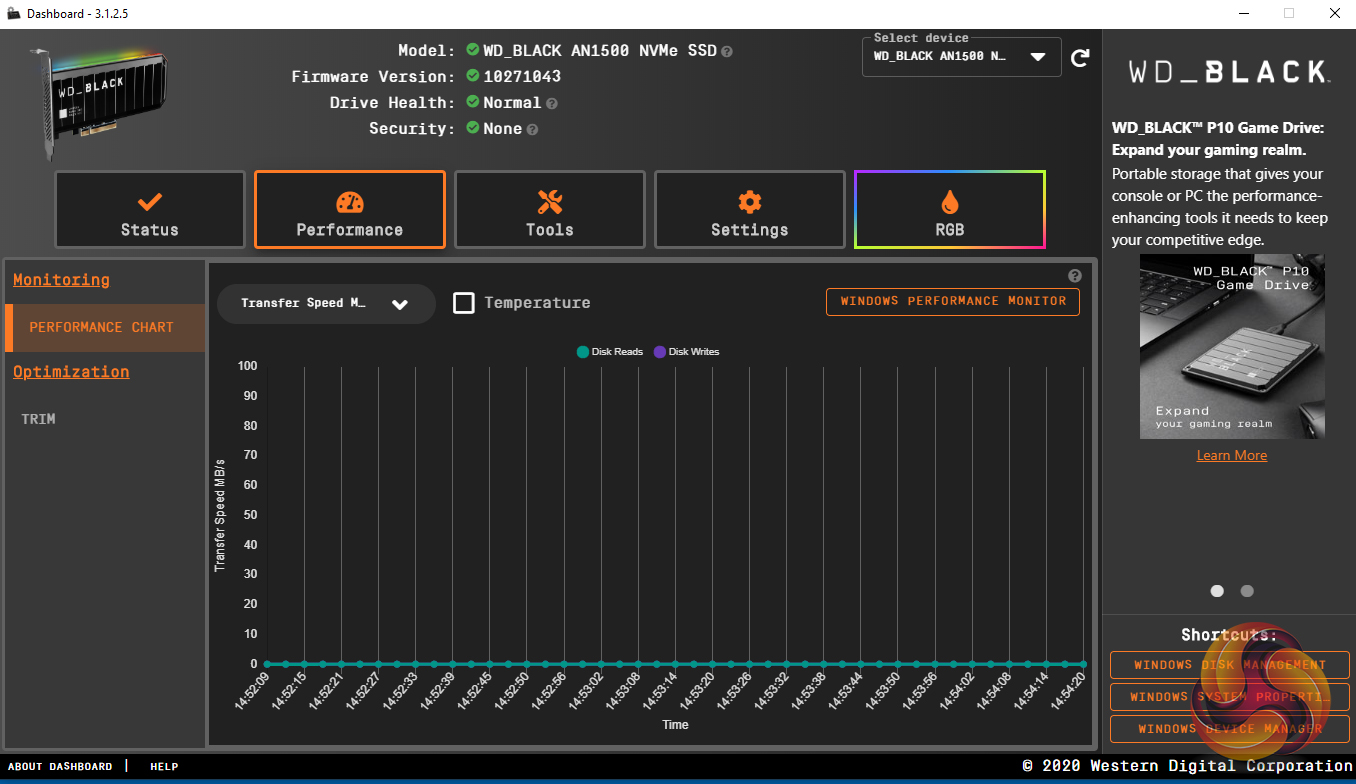
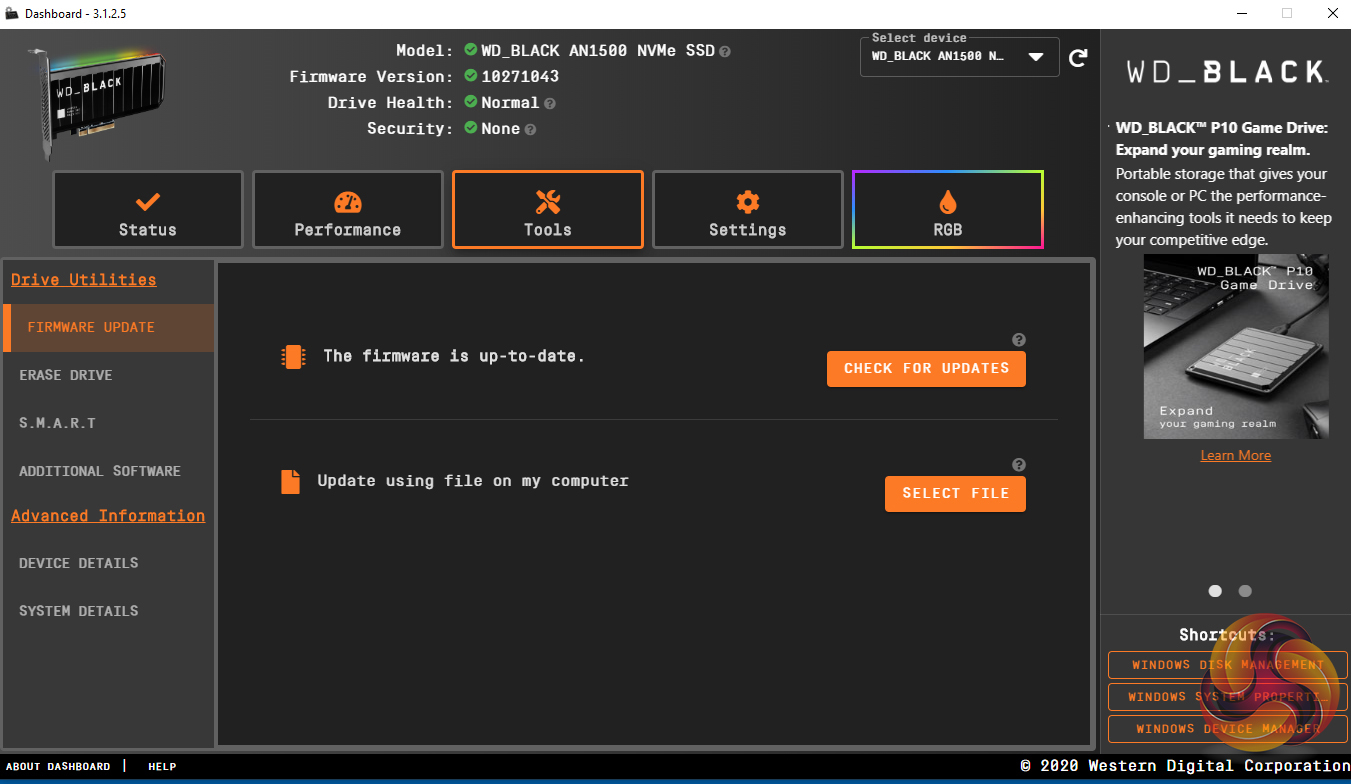
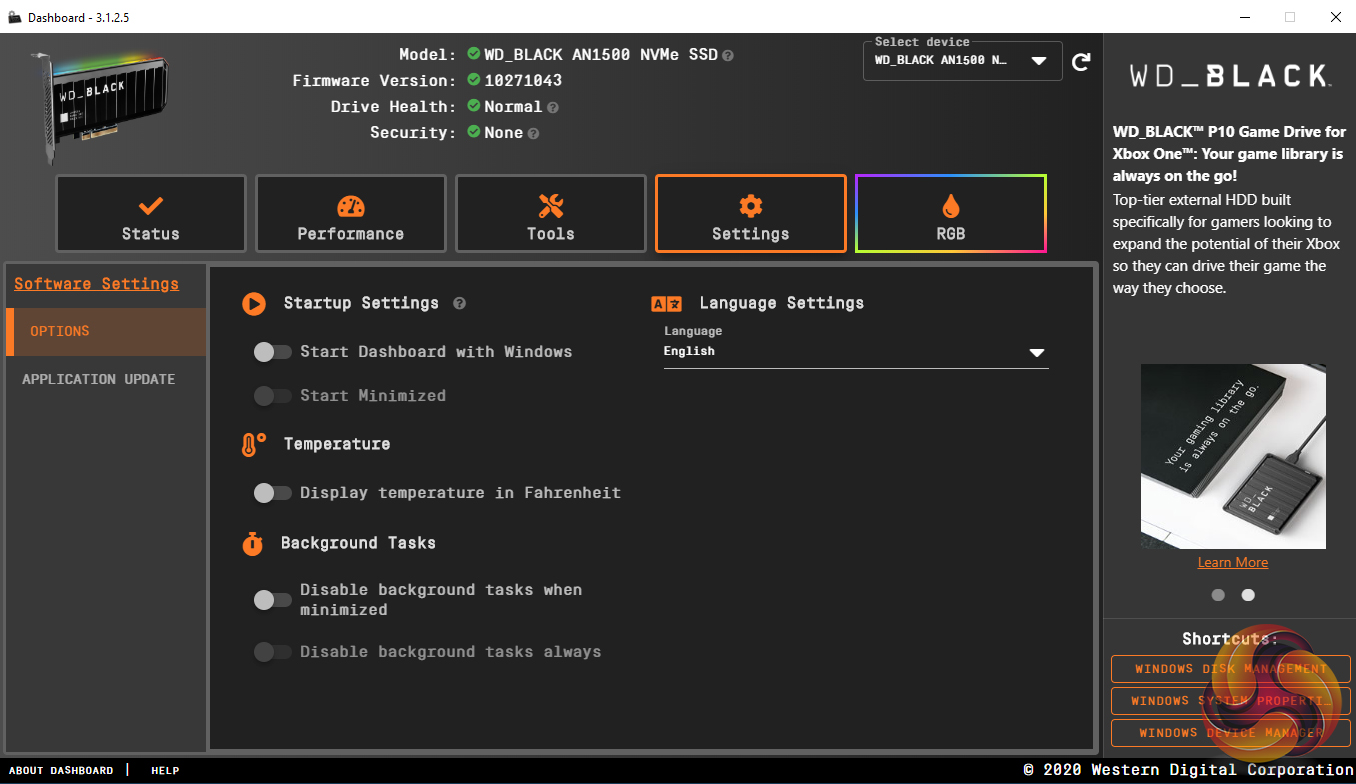
WD's revamped SSD Dashboard (v3.1.25 supports the AN1500) is about as comprehensive an SSD management utility as you'll likely to find. It displays information on drive temperature, life remaining and a whole lot more including a live performance monitor. There isn't any cloning utility incorporated into the dashboard but WD supports the AN1500 with Acronis True Image WD Edition which can download from WD's website.
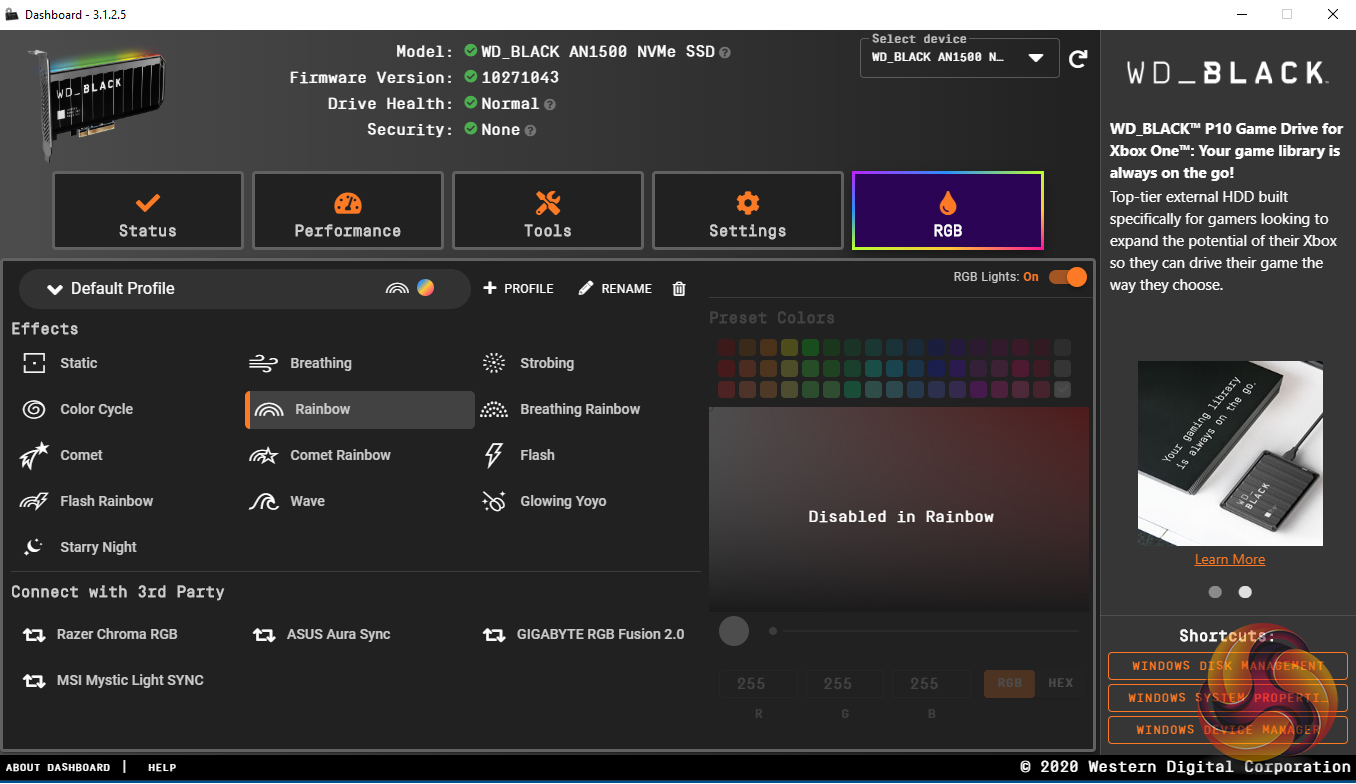
Then, of course, there is the control page for the RGB lighting system which has 13 basic pattern effects with options to tinker about with the colours being used. It is also compatible with the most common of the motherboard RGB systems out there; MSI's Mystic Light Sync, Asus' Aura Sync and Gigabyte's RGB Fusion.
For testing, the drives are all wiped and reset to factory settings by HDDerase V4. We try to use free or easily available programs and some real-world testing so you can compare our findings against your own system.
This is a good way to measure potential upgrade benefits.
Main system:
AMD Ryzen 5 3600X, 16GB DDR4-2400, Sapphire R9 390 Nitro and an MSI MPG X570 Gaming Edge Wifi motherboard
Other drives:
To give an idea of the AN1500's performance we compared it to the 1.2TB version of Kingston's DCP1000 which although designed for data centres use is another AIC PCIe 3.0 x 8 drive, WD's own Black SN750 PCIe 3.0 drive and finally, the 1TB version of Samsung's mighty PCIe 4.0 drive, the SSD980 PRO.
Software:
Atto Disk Benchmark 4.
CrystalMark v6.0 & 7.0.0.
AS SSD 2.0.
IOMeter.
Futuremark PC Mark 10
All our results were achieved by running each test five times with every configuration this ensures that any glitches are removed from the results. Trim is confirmed as running by typing fsutil behavior query disabledeletenotify into the command line. A response of disabledeletenotify =0 confirms TRIM is active.
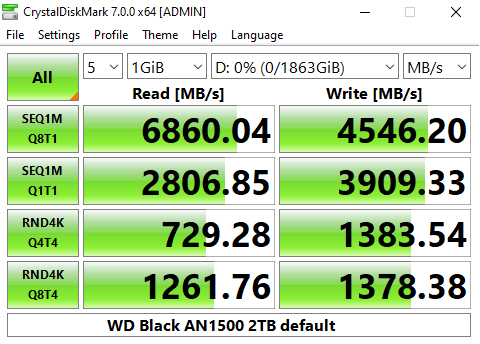
CrystalDiskMark is a useful benchmark to measure theoretical performance levels of hard drives and SSDs. We are using versions 6.0 & 7.0
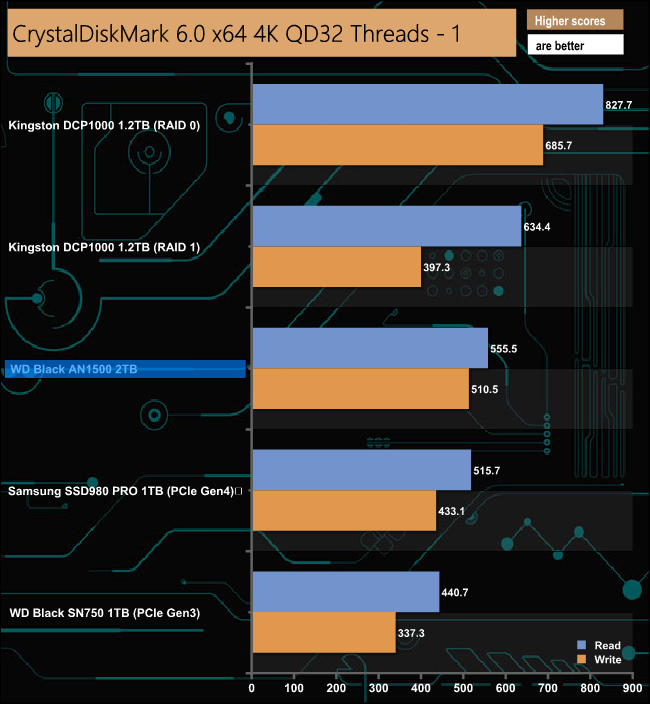
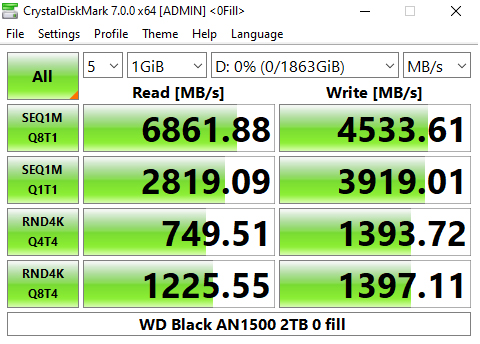
WD's AN1500 outperforms Samsung's PCIe 4.0 drive, the SSD980 PRO in CrystalDiskMark's QD32 test in both read and write performance. Looking at the benchmark result screens it appears that the in-house WD controller doesn't have a preference in the data it's being asked to handle.

At a queue depth of one, the position of the drives changes with the Samsung SSD980 PRO faster for read and writes than the AN1500.
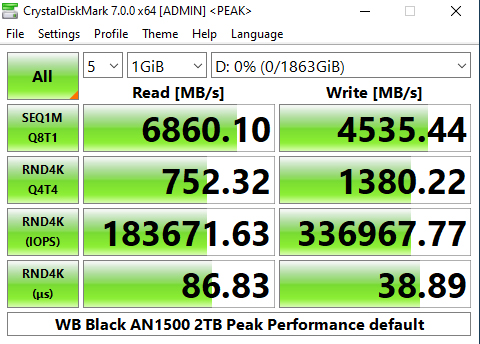
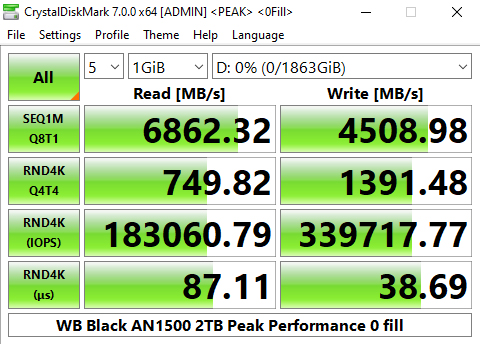
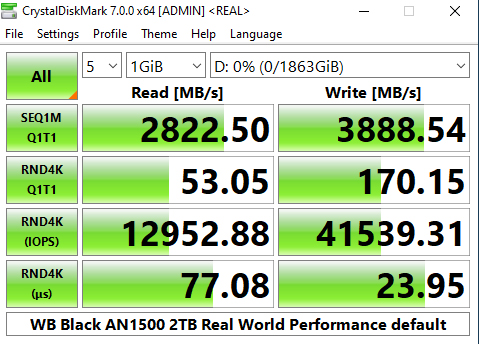
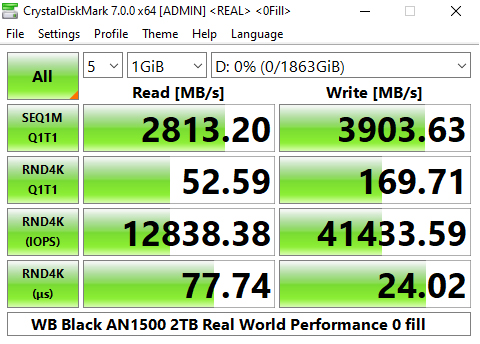
The latest version of CrystalDiskMark, version 7, includes a couple of profiles that can be used for testing – Peak Performance and Real World. The result screens for these two profiles not only display MB/s results but also IOPS and latency.
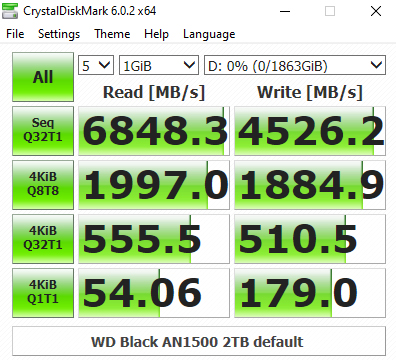
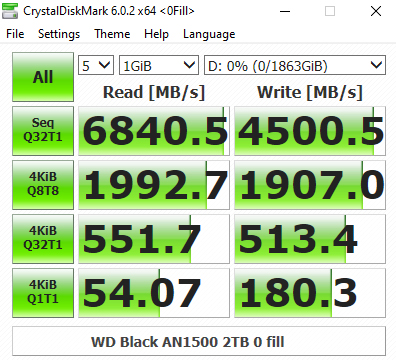
Looking at the Peak Performance results for Sequential read/write performance we could confirm both official Sequential performance figures. The drive is rated up to 6,500MB/s for reads, with the tested drive producing 6,860MB/s and up to 4,100MB/s for writes, with a test result of 4,535MB/s.
When it comes to random performance the drive is rated as up to 780,000 IOPS for reads and up to 700,000 IOPS for writes but as you can see from the Peak Performance results, the best we saw from the drive in the CDM 7 benchmark was 183,671 IOPS for reads and 336,967 IOPS for writes.
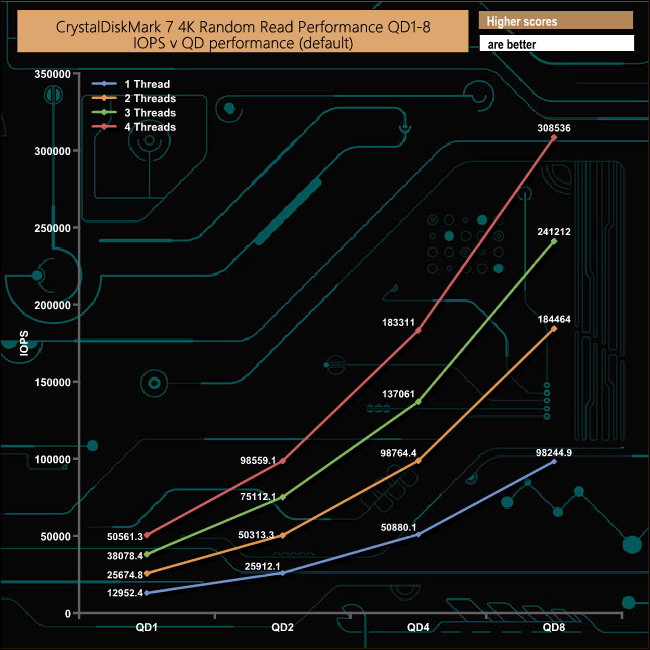
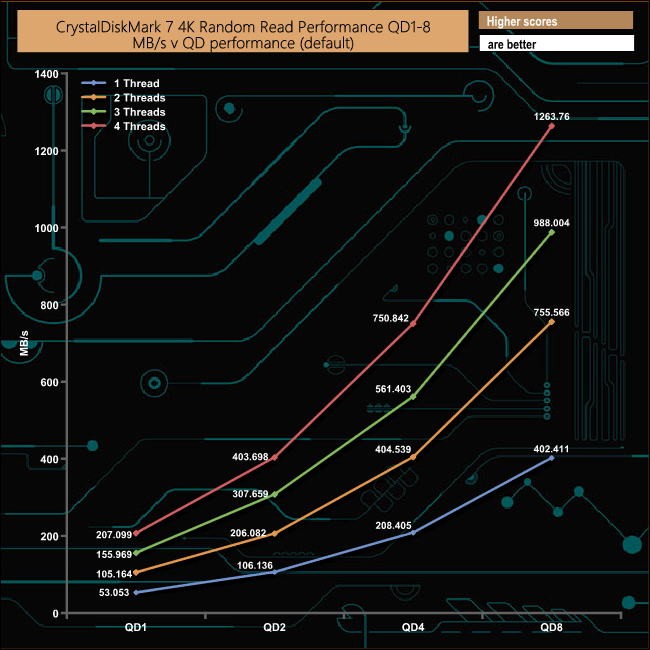
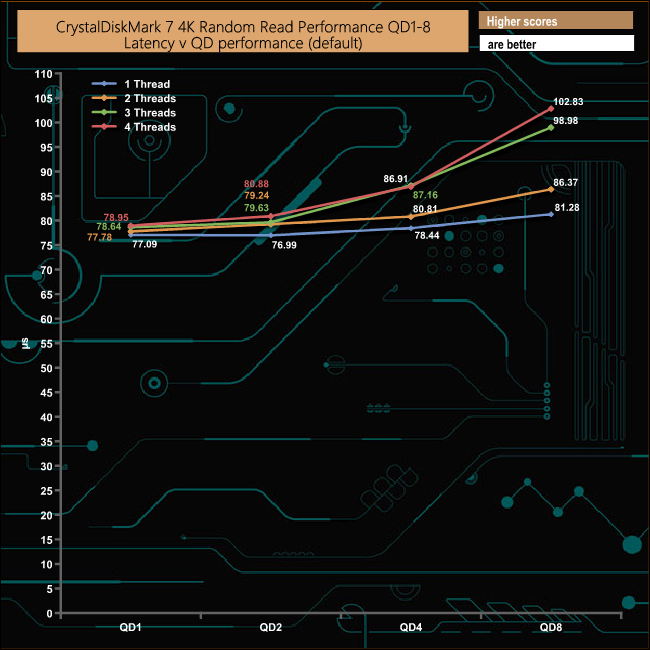
We also used CrystalDiskMark 7 to test the drive at lower queue depths (where most of the everyday workloads occur) using 1 to 4 threads. The read performance climbs smoothly through each of the tested queue depths.
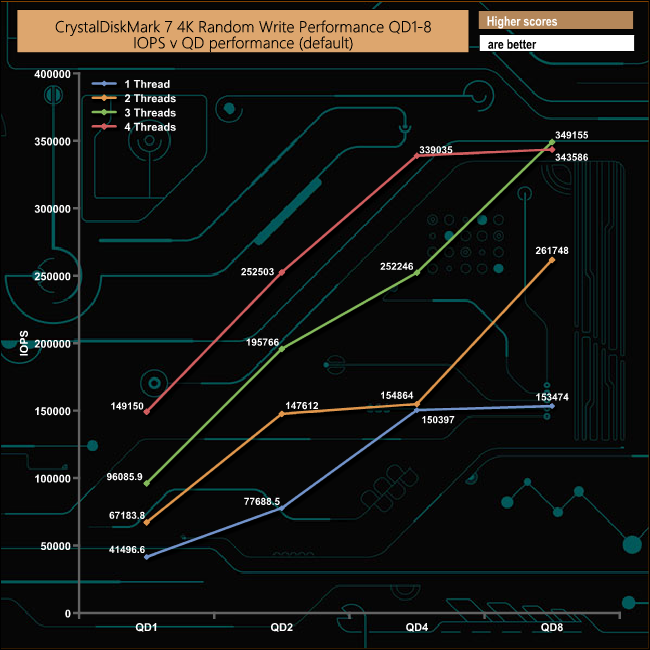
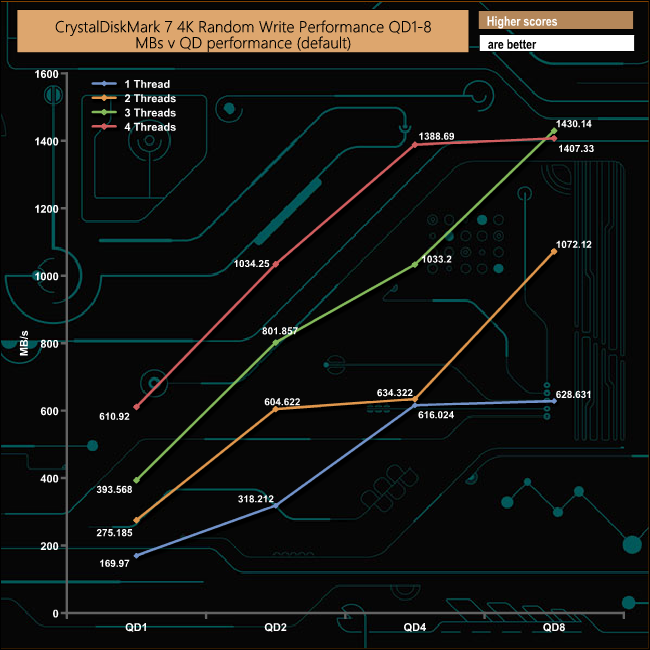
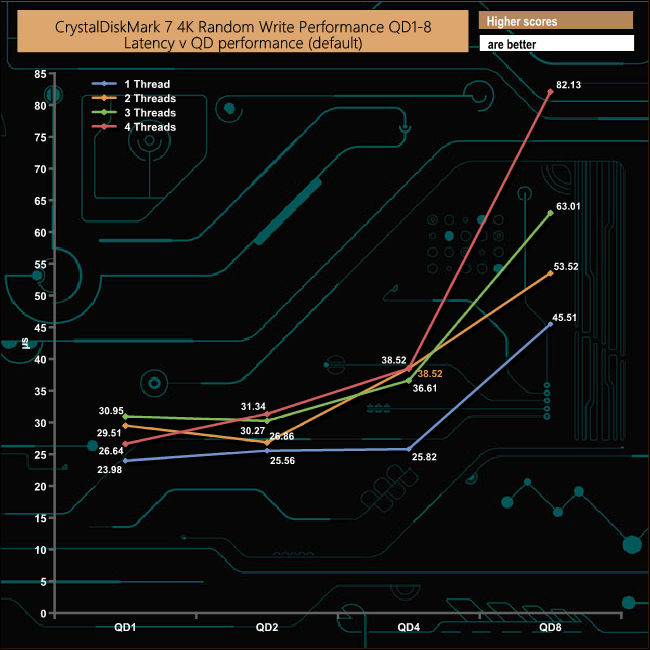
In the write tests, the best overall performance comes from the 3-threaded tests which climbs pretty smothly in performance as the queue depth deepens. Both the single threaded and 4-threaded performance begins to level off at the QD4 mark, while at a QD of 2 the performance looks like its beginning to level off only to increase again from QD4 to QD8.
The ATTO Disk Benchmark performance measurement tool is compatible with Microsoft Windows. Measure your storage systems performance with various transfer sizes and test lengths for reads and writes. Several options are available to customize your performance measurement including queue depth, overlapped I/O and even a comparison mode with the option to run continuously.
Use ATTO Disk Benchmark to test any manufacturers RAID controllers, storage controllers, host adapters, hard drives and SSD drives and notice that ATTO products will consistently provide the highest level of performance to your storage.
We are using version 4.0 for our NVMe disk tests.
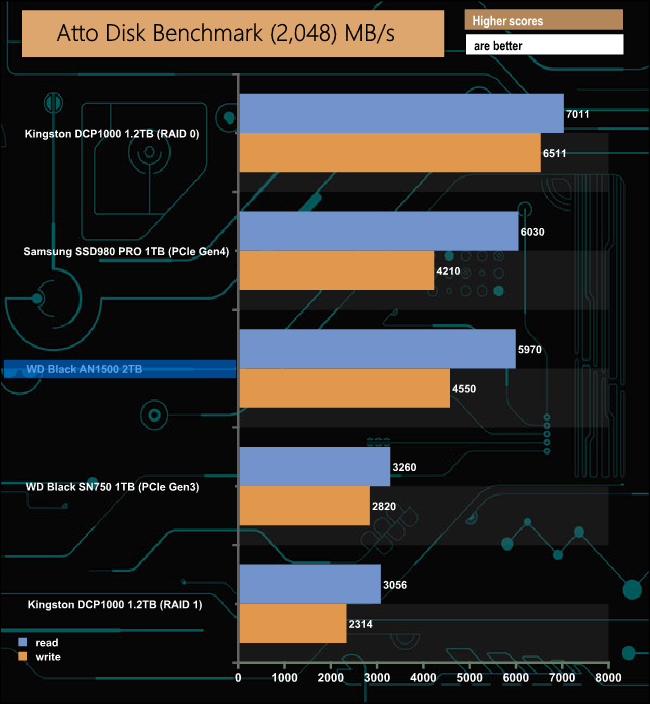
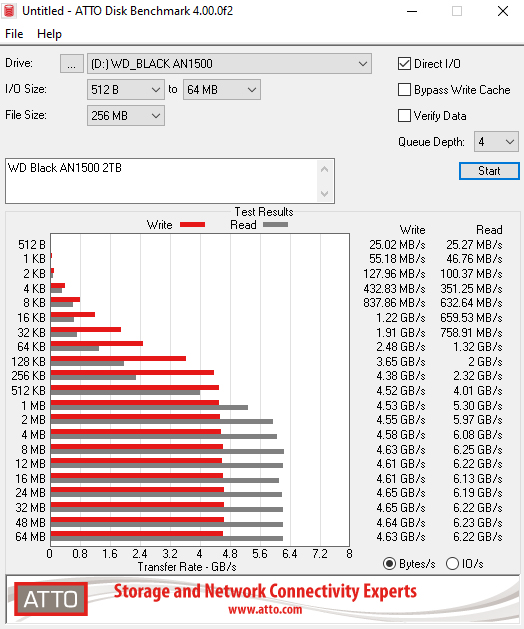
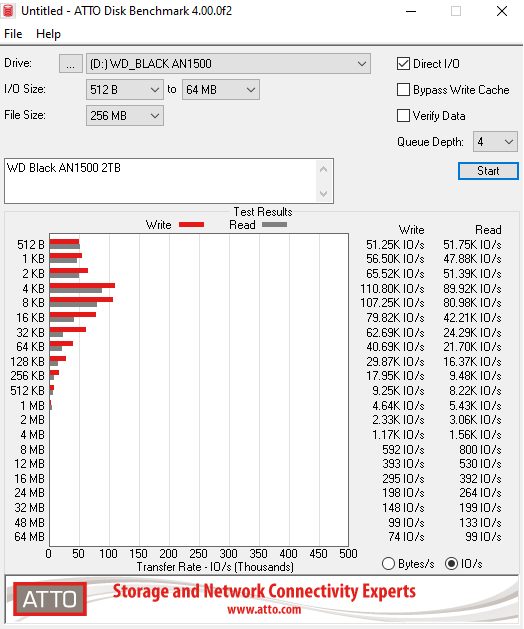
Officially the AN1500 is rated as up to 6,500MB/s for Sequential reads and up to 4,100MB/s for writes. Using the ATTO benchmark we couldn't quite get to that maximum read rating, with the review drive producing a figure of 5,970MB/s at our selected 2MB I/O size. Writes on the other hand at 4,550MB/s, bettered the official rating.
AS SSD is a great free tool designed just for benching Solid State Drives. It performs an array of sequential read and write tests, as well as random read and write tests with sequential access times over a portion of the drive. AS SSD includes a sub suite of benchmarks with various file pattern algorithms but this is difficult in trying to judge accurate performance figures.
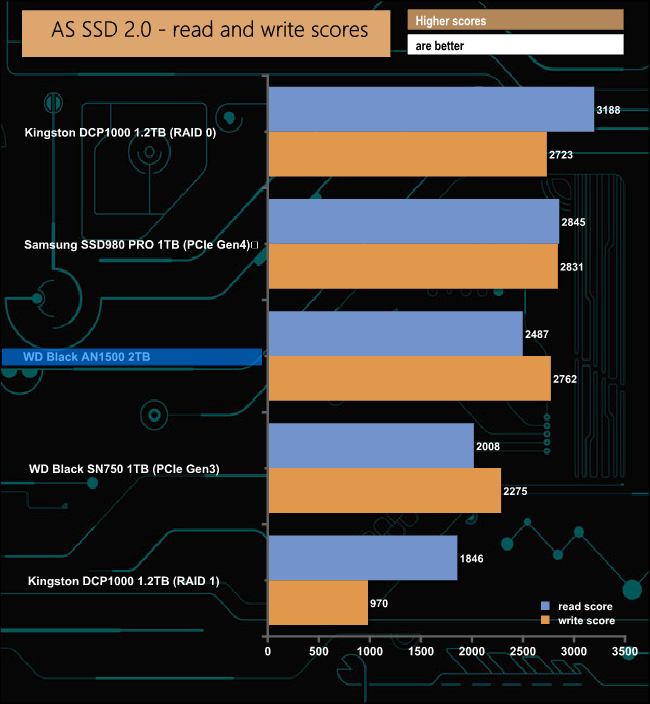
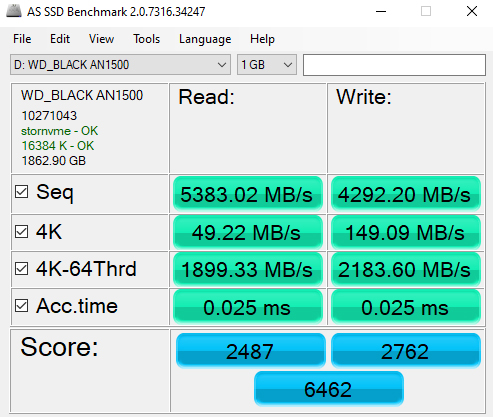
Although the AS-SSD benchmark read score of 2487 for the AN1500 is a fair bit slower than Samsung SSD980 PRO, the write score of 2762 is very much closer to the Samsung drive.
IOMeter is another open-source synthetic benchmarking tool which is able to simulate the various loads placed on the hard drive and solid-state drive technology. There are many ways to measure the IOPS performance of a Solid State Drive, so our results will sometimes differ from the manufacturer’s quoted ratings. We do test all drives in exactly the same way, so the results are directly comparable.
We test 128KB Sequential read and write and random read and write 4k tests. The test setup’s for the tests are listed below. Each is run five times.
128KB Sequential Read / Write.
Transfer Request Size: 128KB Span: 8GB Thread(s): 1, Outstanding I/O: 1-32 Test Run: 20 minutes per test.
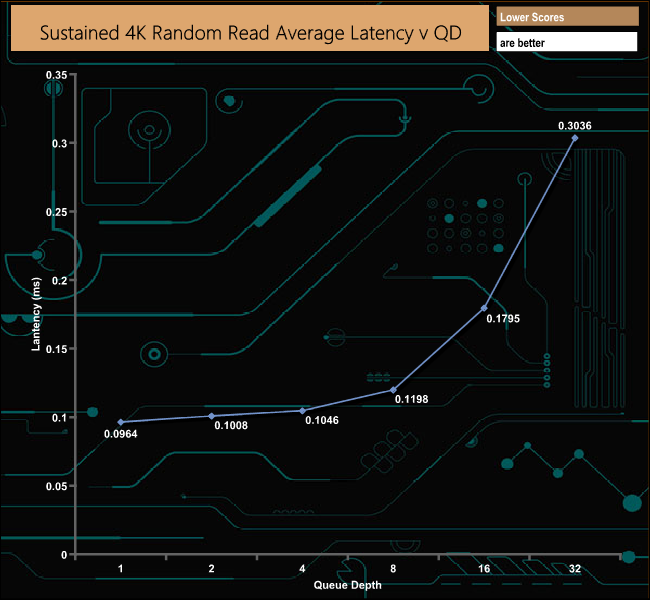
4K Sustained Random Read / Write.
Transfer Request Size: 4KB Span: 80GB Thread(s): 4, Outstanding I/O: 1-32 Test Run: 20 minutes per test.
4K Random 70/30 mix Read/Write.
Transfer Request Size: 4KB Span: 80GB Reads: 70% Writes: 30% Thread(s): 4 Outstanding I/O: 2 – 32 Test Run: 20 minutes.
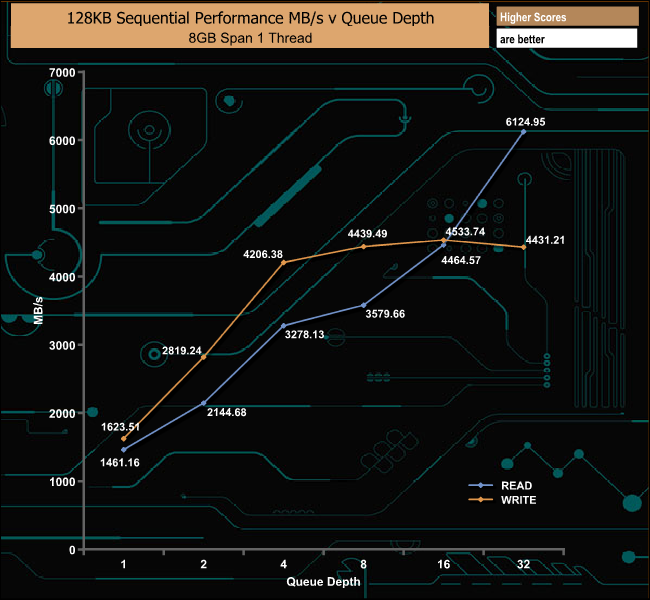
Using our own Sequential tests, the best read performance figure we saw was 6,124.95MB/s (QD32), a little way off the official maximum of 6,500MB/s. On the other hand, the best write figure of 4,431.21MB/s we got from the review drive when tested bettered the official 4,100MB/s.
128KB Sequential Read v QD Performance Compared.
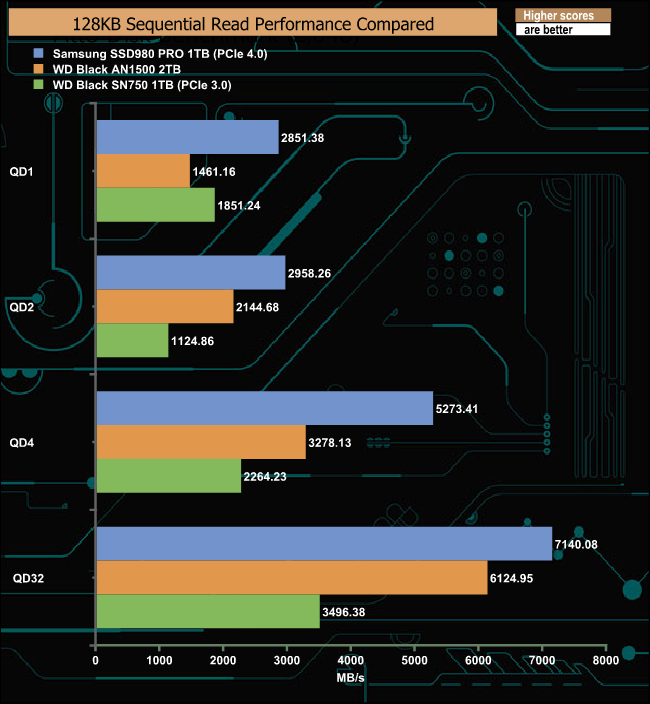
The nearest the AN1500 gets to the Samsung SSD980 PRO in our Sequential read test is at a QD of 2. The biggest gap in performance happens at a QD of 4. the Samsung drive being some 1,995MB/s faster than the WD drive.
128KB Sequential Write v QD Performance Compared.
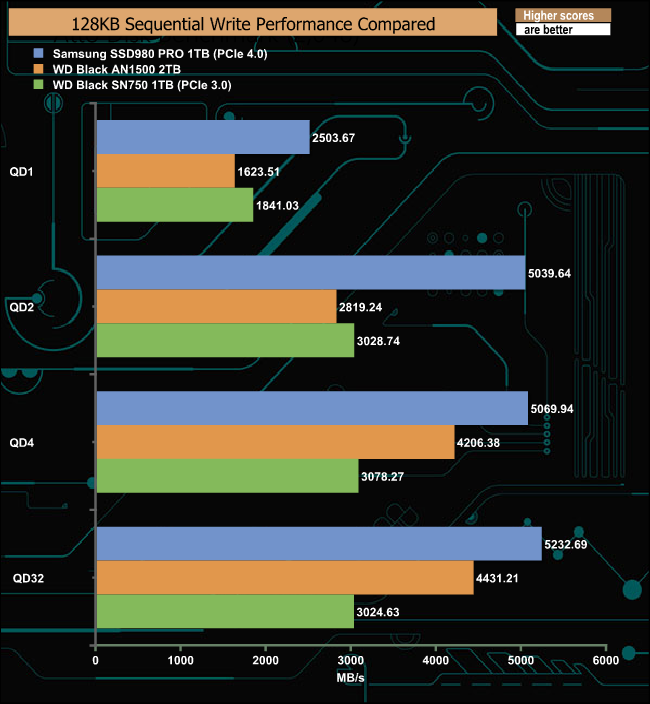
When it comes to Sequential writes, the gap between the WD AN1500 and the Samsung SSD980 PRO reduces as the queue depth deepens.
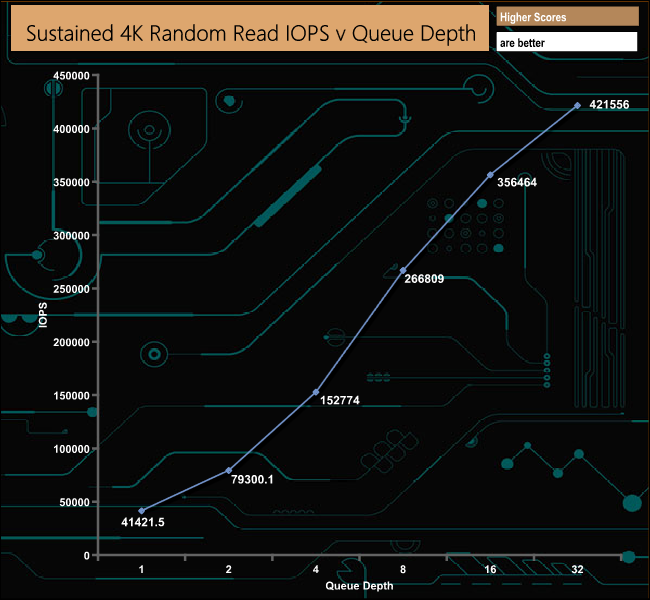
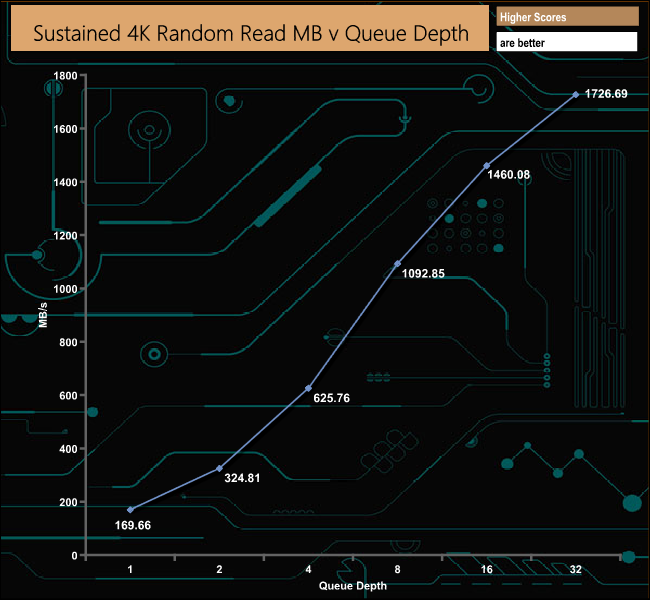
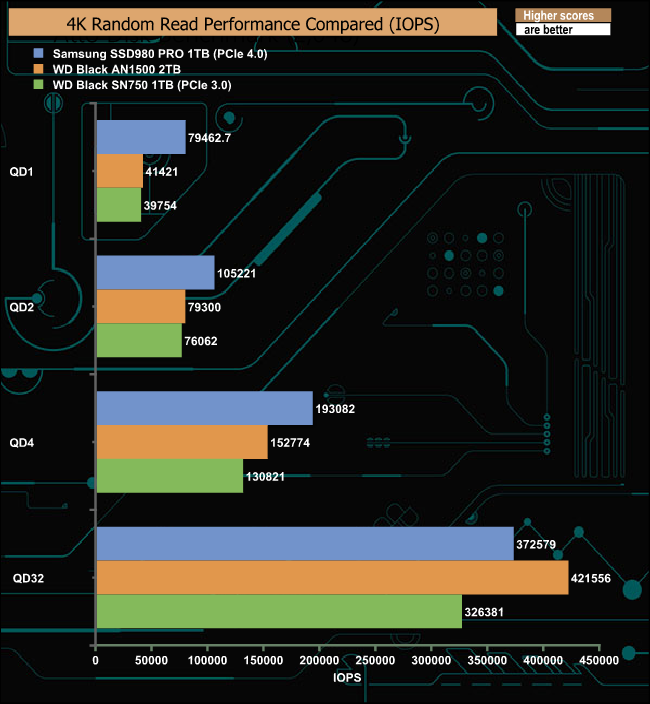
In our 4-threaded 4K testing, the Samsung SSD980 PRO outpaces the AN1500 until QD32 when the AN1500 outperforms the PCIe 4.0 drive, although the test result of 421,556 IOPS is way off of the official maximum random read figure of 780,000 IOPS.
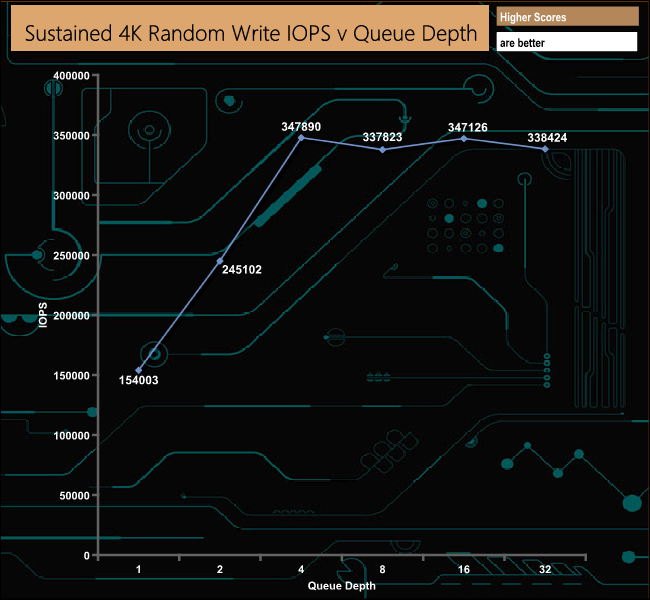
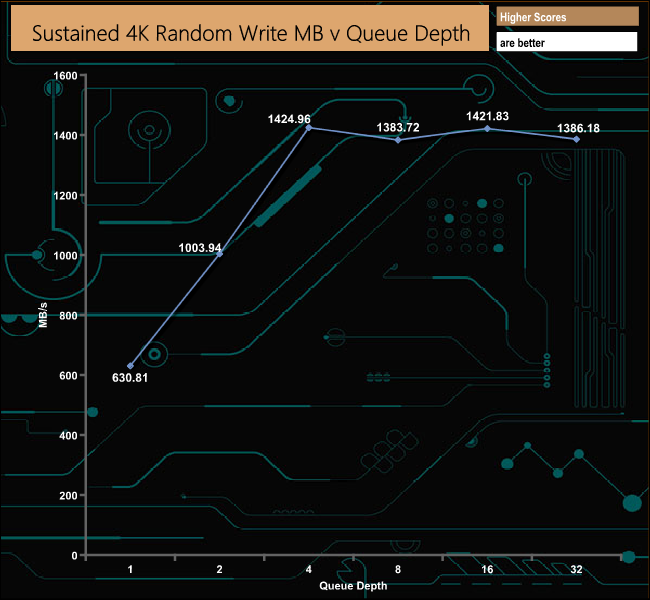
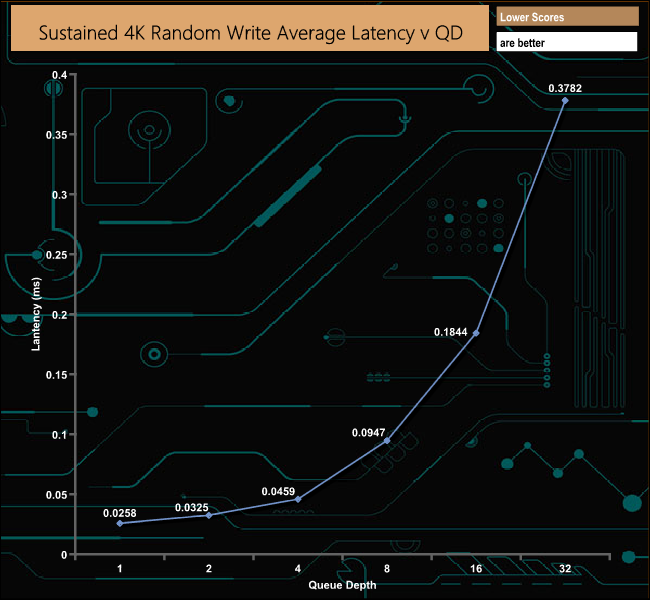
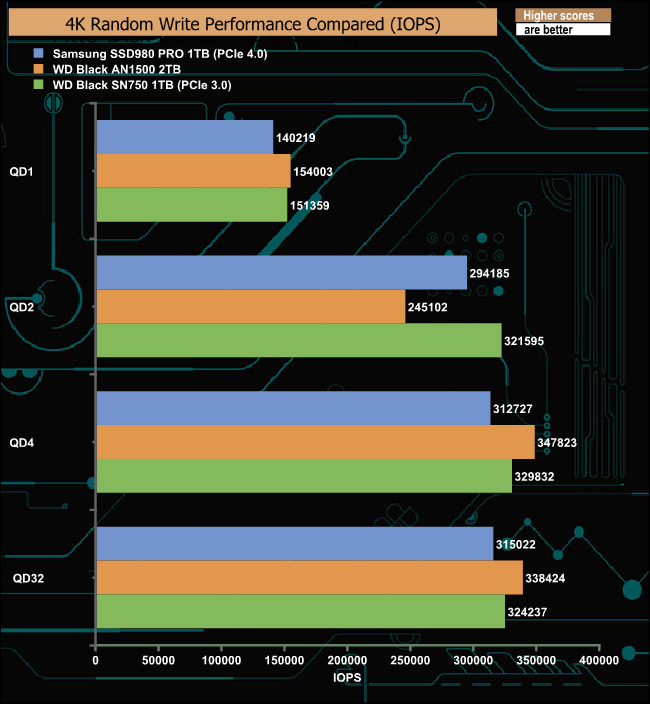
In our 4-threaded 4K random write tests, the only time the PCIe 4.0 Samsung SSD980 PRO has the upper hand over the AN1500 is at QD2. At this queue depth, the PCIe 3.0 WD Black SN750 outperforms both of the newer drives.
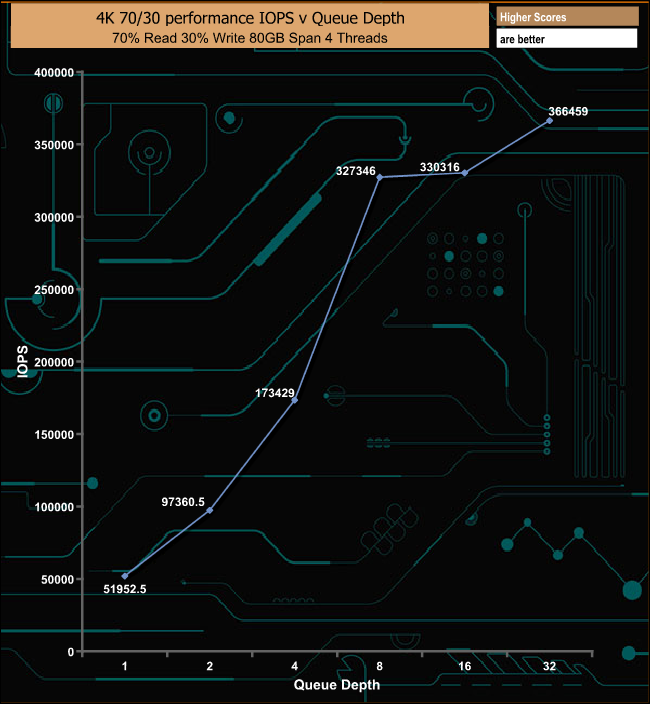
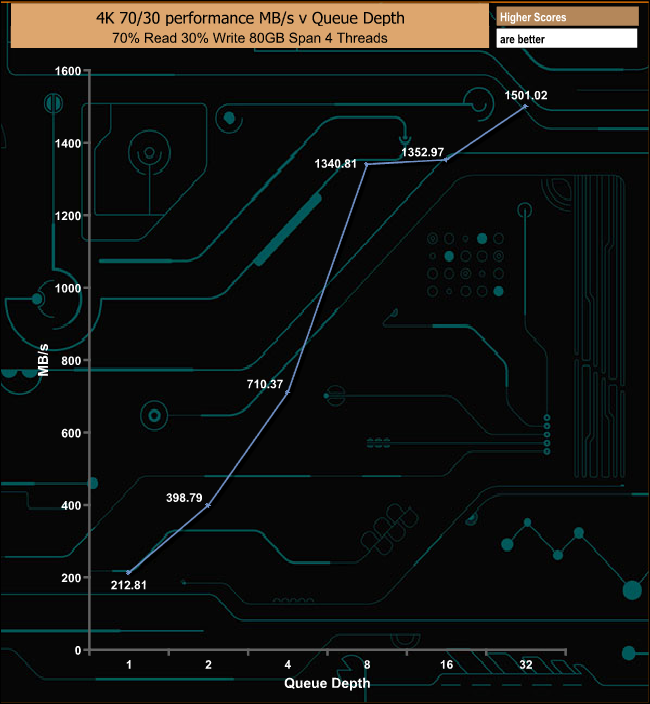
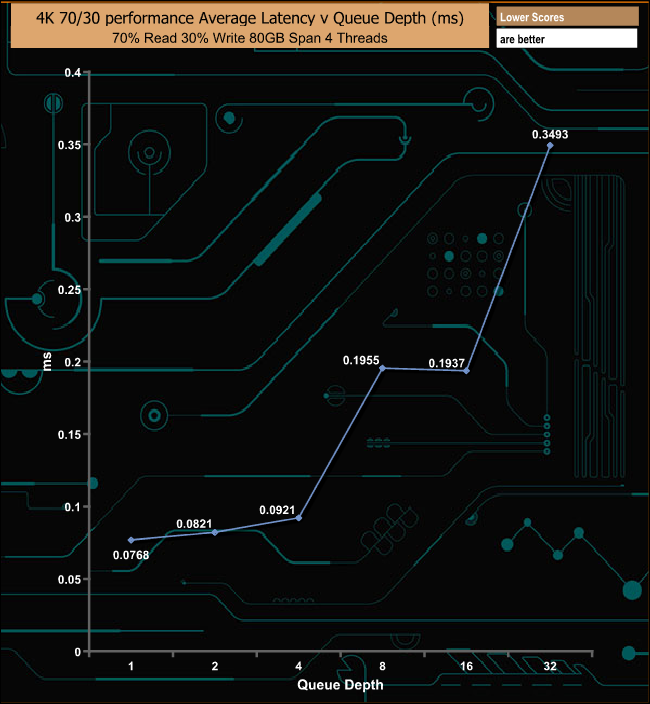
In our 4K 70/30 mixed test, the AN1500 performs well between queue depths 1 and 8 before the performance begins to level off between QD 8 and QD16, but between QD16 and QD32 the performance picks up again, to finish the test run at 366,459 IOPS (1,501.02MB/s).
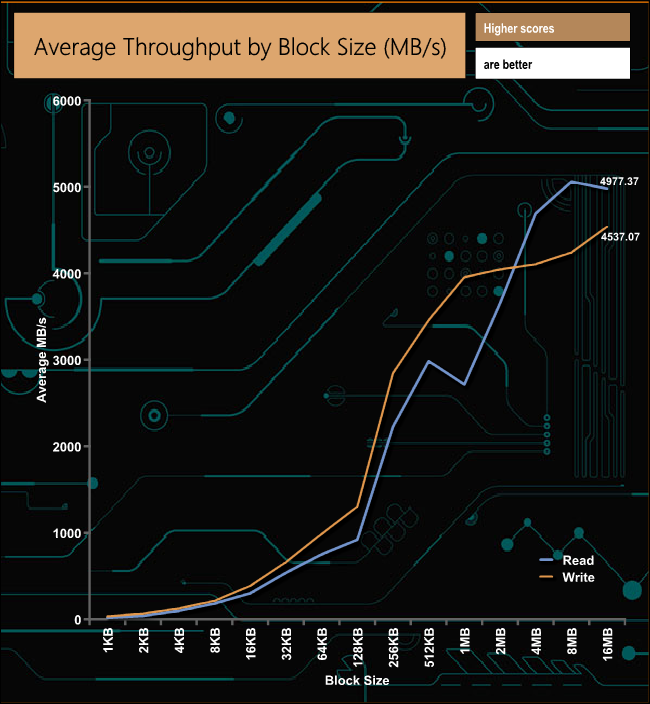
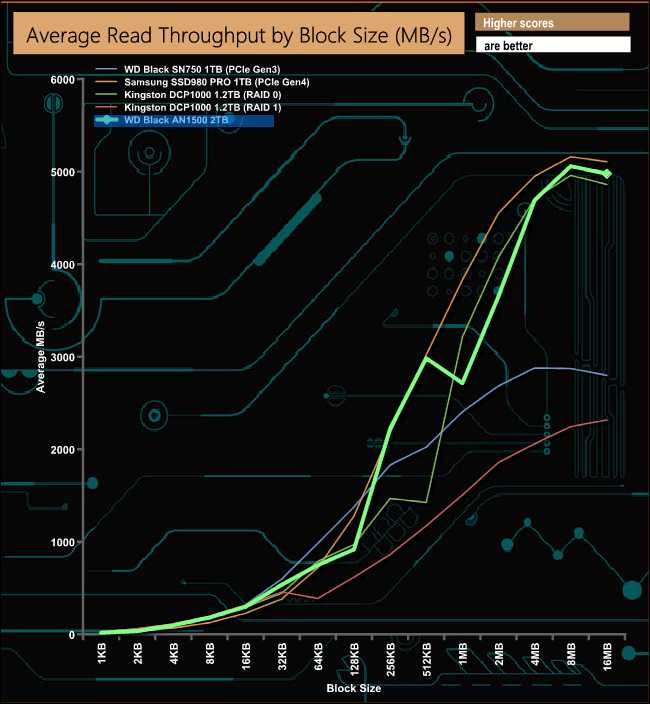
In our read throughput test, the AN1500 peaks at 5,059MB/s at the 8MB block mark, before dropping back slightly to finish the test run at 4,977.37MB/s. That peak figure of 5,059MB/s is some way short of the official maximum of 6,500MB/s.
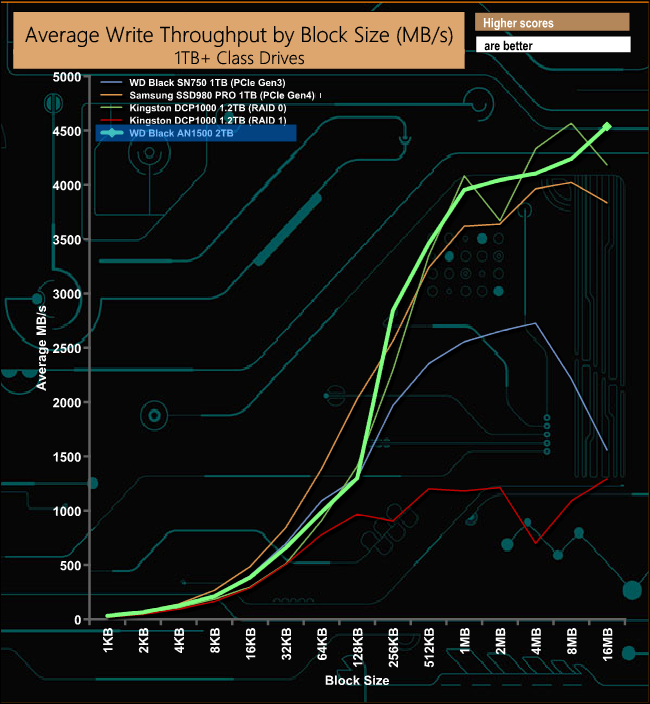
In the write throughput test, the peak performance came at the end of the test at 4,537MB/s, which betters the official maximum write figure of 4,100MB/s.
The PCMark 10 Full System Drive Benchmark uses a wide-ranging set of real-world traces from popular applications and common tasks to fully test the performance of the fastest modern drives. The benchmark is designed to measure the performance of fast system drives using the SATA bus at the low end and devices connected via PCI Express at the high end.
The goal of the benchmark is to show meaningful real-world performance differences between fast storage technologies such as SATA, NVMe, and Intel’s Optane. The Full System Drive Benchmark uses 23 traces, running 3 passes with each trace. It typically takes an hour to run.
Traces used:
Booting Windows 10.
Adobe Acrobat – starting the application until usable.
Adobe Illustrator – starting the application until usable Adobe Premiere Pro – starting the application until usable.
Adobe Photoshop – starting the application until usable.
Battlefield V – starting the game until the main menu.
Call of Duty Black Ops 4 – starting the game until the main menu.
Overwatch – starting the game until main menu.
Using Adobe After Effects.
Using Microsoft Excel.
Using Adobe Illustrator.
Using Adobe InDesign.
Using Microsoft PowerPoint.
Using Adobe Photoshop (heavy use).
Using Adobe Photoshop (light use).
cp1 Copying 4 ISO image files, 20 GB in total, from a secondary drive to the target drive (write test).
cp2 Making a copy of the ISO files (read-write test).
cp3 Copying the ISO to a secondary drive (read test).
cps1Copying 339 JPEG files, 2.37 GB in total, to the target drive (write test).
cps2 Making a copy of the JPEG files (read-write test).
cps3 Copying the JPEG files to another drive (read test).

The two best performances in the creative group of test traces were the 657MB/s from the Adobe Photoshop heavy use test and the 339MB/s from the Adobe After Effects test.
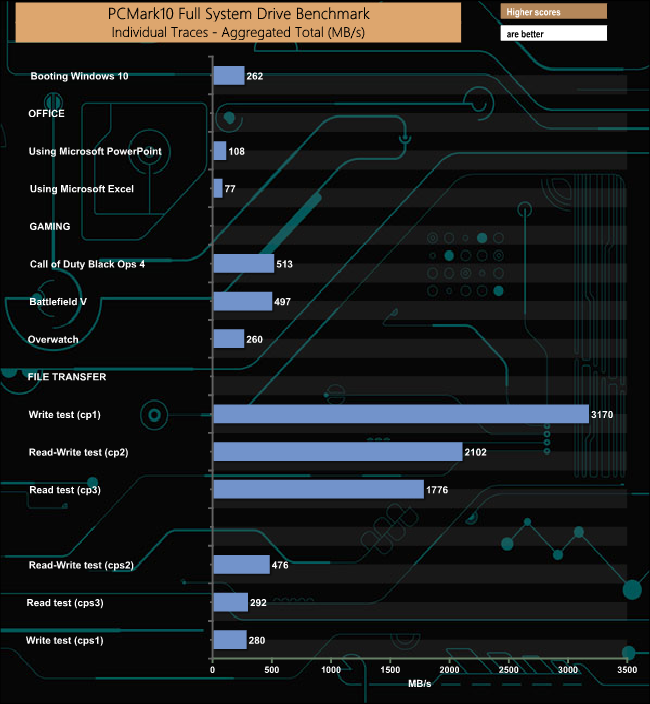
The AN1500 displayed very strong performance when dealing with the JPEG files of the cps file transfer tests.
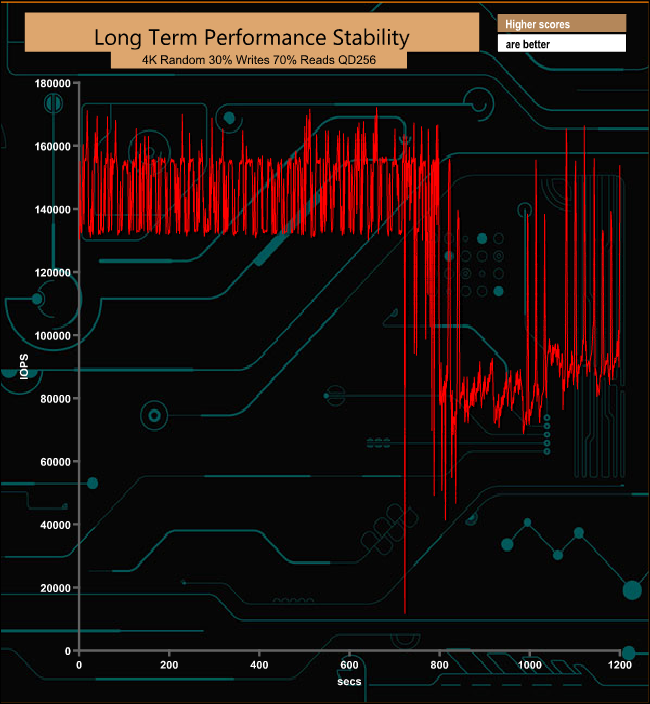
For the long term performance stability test, we set the drive up to run a 20-minute 4K random test with a 30% write, 70% read split, at a Queue Depth of 256 over the entire disk. The 2TB WD Black AN1500 averaged 126,938 IOPS for the test with a performance stability of 76%.
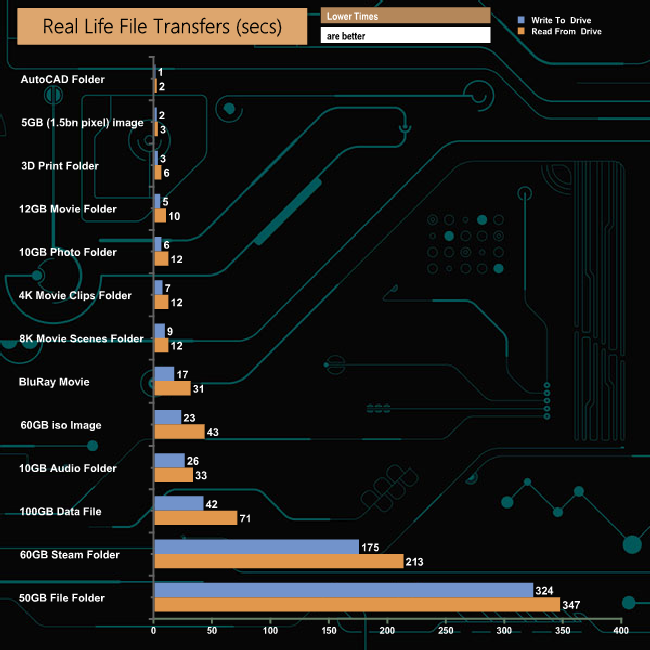
To test real-life performance of a drive we use a mix of folder/file types and by using the FastCopy utility (which gives a time as well as MB/s result) we record the performance of drive reading from & writing to a 256GB Samsung SSD850 PRO.
100GB data file.
60GB iso image.
60GB Steam folder – 29,521 files.
50GB File folder – 28,523 files.
12GB Movie folder – (15 files – 8 @ .MKV, 4 @ .MOV, 3 @ MP4).
10GB Photo folder – (304 files – 171 @ .RAW, 105 @ JPG, 21 @ .CR2, 5 @ .DNG).
10GB Audio folder – (1,483 files – 1479 @ MP3, 4 @ .FLAC files).
5GB (1.5bn pixel) photo.
BluRay Movie – 42GB.
21GB 8K Movie demos – (11 demos)
16GB 4K Raw Movie Clips – (9 MP4V files).
4.25GB 3D Printer File Folder – (166 files – 105 @ .STL, 38 @ .FBX, 11 @ .blend, 5 @ .lwo, 4 @ .OBJ, 3@ .3ds).
1.5GB AutoCAD File Folder (80 files – 60 @ .DWG and 20 @.DXF).
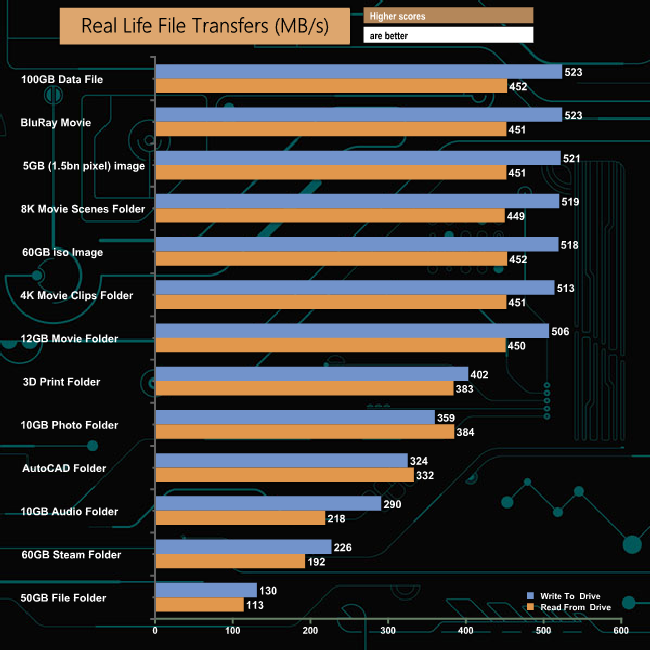
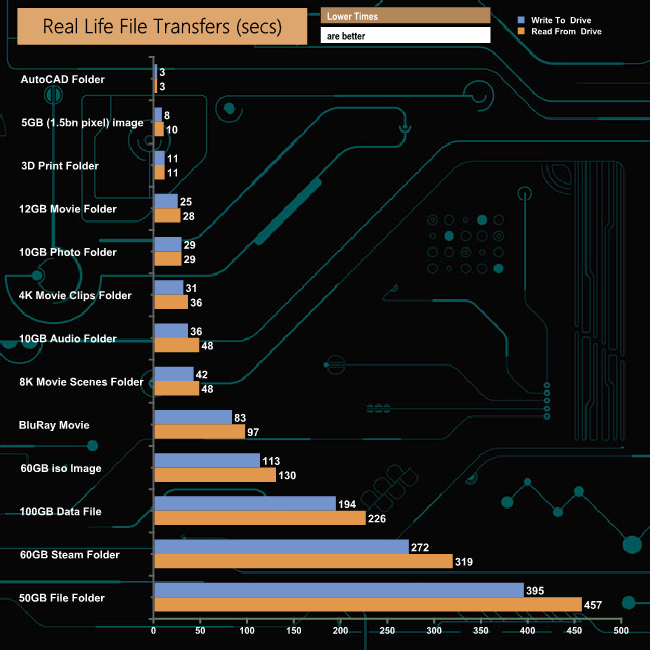
WD's AN1500 displayed a very good consistency of performance for both reads and writes when dealing with the larger file sizes in our file transfer tests.
To get a measure of how much faster PCIe NVMe drives are than standard SATA SSDs we use the same files but transfer to and from a 512GB Toshiba OCZ RD400.
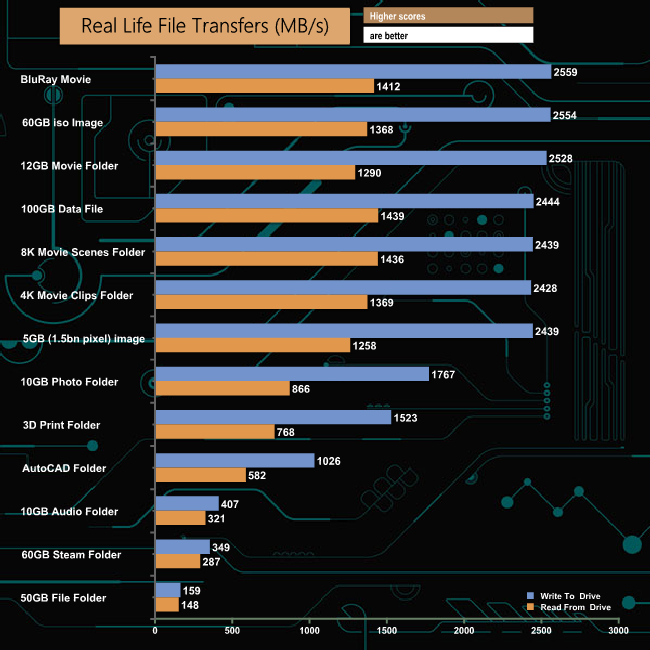
When transfering files to and from another NVMe drive, the AN1500 showed just how fast it can be with seven of the thirteen tests producing a write figure over 2GB/s with three (Blu-ray, 60GB iso image and 12GB movie folder) over 2.5GB/s.
WD's new Black AN1500 drive has been designed to cater for the needs of gamers/enthusiasts who are wanting a drive with PCIe Gen 4 levels of performance but are using a motherboard with only PCIe 3.0 architecture. There are three capacities of AN1500 currently available; 1TB, 2TB and the flagship 4TB drive.
To try and achieve their goal, WD has gone down the AIC (add-in-card) route. Sitting under the AN1500's aluminium top cover is a pair of WD's PC SN730 NVMe (96-Layer 3D TLC NAND) SSDs which are built into a RAID 0 hardware array, which is looked after by a Marvell 88NR2241 RAID controller. The drive uses a PCIe 3.0 x8 interface so it goes without saying that to get the full benefit of the AN1500 you need to make sure you have a PCIe 3.0 slot with 8 PCIe lanes free.
The drive has aluminium covers for both sides of the PCB to act as heatsinks, as with two fast NVMe SSDs and a RAID controller things can get rather toasty when the drive is being pushed.
WD quote Sequential read/write figures for the 2TB drive as up to 6,500MB/s and up to 4,100MB/s respectively. Incidentally, they are the same speeds for the 1TB and 4TB drives as well. Using the ATTO benchmarking tool (ver 4) we couldn't get to the maximum official rating, the tested drive producing a figure of 5,970MB/s. We got a bit closer with our own Sequential read test at 6,124MB/s. However, when tested with CrystalDiskMark 7 Peak Performance profile we could indeed confirm that official figure with a test result of 6,860MB/s. As for Sequential writes, we could confirm the official figure with all our tests. 4,526MB/s in CrystalDiskMark 7 Peak Performance, 4,550MB/s in ATTO and 4,431MB/s in our own tests.
The 2TB AN1500 is officially rated as up to 780,000 IOPS for random reads and up to 700,000 IOPS for random writes. We couldn't get close to these figures with our 4-threaded tests. The best read figure we saw was 421,556 IOPS (QD32) while the best write figure came at QD16 at 347,126 IOPS. We did a quick test using 8 threads at a QD of 32 and still came up short at 602,422 IOPS for reads and 532,202 IOPS for writes.
As with so many other bits of hardware these days, the AN1500 comes with RGB lighting. The lighting system uses 16 LEDs that sit behind a diffused cover that runs the whole length of the top of the drive and one side. The system is controlled by a page of WD's very good SSD Dashboard (version 3.1.25 supports the AN1500) drive management software. There are 13 basic pattern effects with options to fettle about with colour choice for most of them. The system is also compatible with MSI's Mystic Light Sync, Asus' Aura Sync and Gigabyte's RGB Fusion systems.
We found the 2TB WD AN1500 on Span.com for £568.80 (inc VAT) HERE
Pros
- Overall performance.
- WD SSD Dashboard software.
- 5-year warranty.
Cons
- Needs 8 PCIe lanes for full performance.
- Couldn't match official 4K figures under testing.
- Power consumption.
KitGuru says: WD's AN1500 delivers near PCIe 4.0 type performance for those people who are using PCIe 3.0 based systems and it comes in some useful capacities but it carries a hefty price tag.