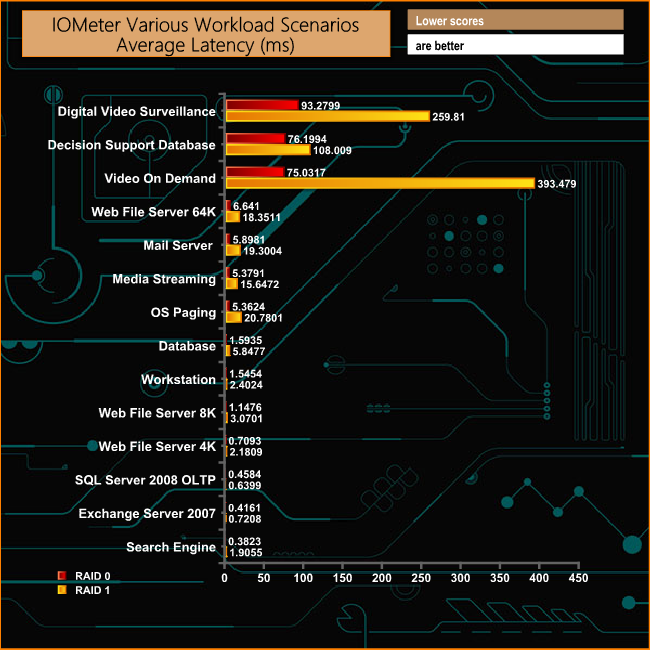
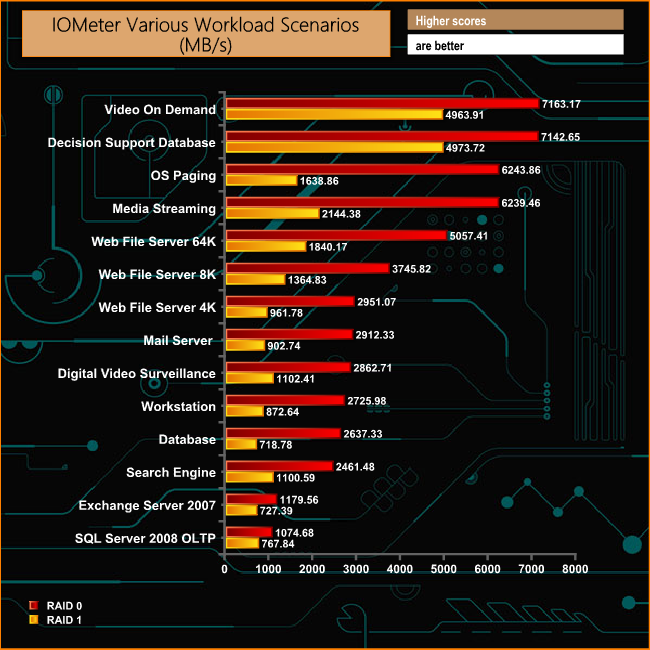
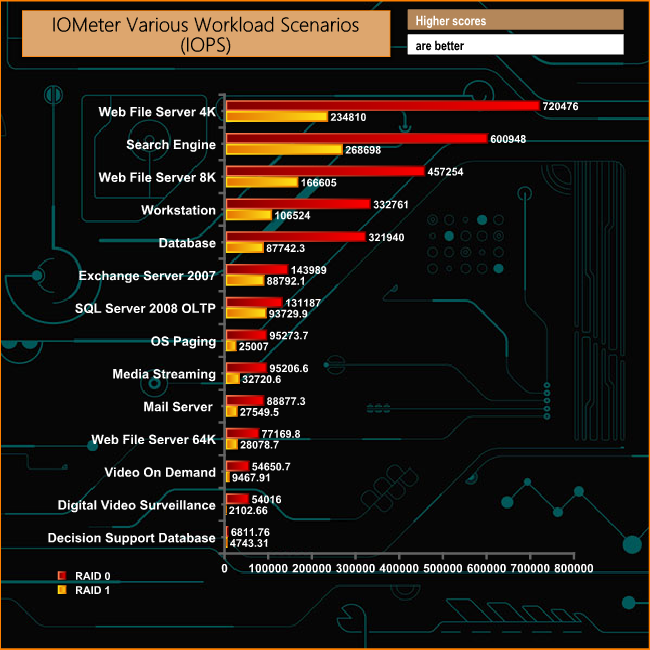
We also tested the drive in a number of workload scenarios that it might face in real life. The IOMeter settings we used to test with are listed below:-
Database
Transfer Size: 8K
Reads 67% Writes 33%
Random 100%
Boundry 4K Outstanding IO 64 Threads/Workers: 8
Exchange Server 2007
Transfer Size: 8K
Reads 67% Writes 33%
Random 100%
Boundry 8K Outstanding IO 60 Threads/Workers: 1
SQL Server 2008 OLTP
Transfer Size: 8K
Reads 70% Writes 30%
Random 100%
Boundry 8K Outstanding IO 60 Threads/Workers: 1
Web File Server 64KB
Transfer Size: 64K
Reads 95% Writes 5%
Random 75%
Boundry 4K Outstanding IO 64 Threads/Workers: 8
Web File Server 8KB
Transfer Size: 8K
Reads 95% Writes 5%
Random 75%
Boundry 4K Outstanding IO 64 Threads/Workers: 8
Web File Server 4KB
Transfer Size: 8K
Reads 95% Writes 5%
Random 75%
Boundry 4K Outstanding IO 64 Threads/Workers: 8
Media Streaming
Transfer Size: 64K
Reads 98% Writes 2%
Sequential 100%
Boundry 4K Outstanding IO 64 Threads/Workers: 8
Video On Demand
Transfer Size: 128K
Reads 100% Writes 0%
Random 100%
Boundry 4K Outstanding IO 512 Threads/Workers: 8
Decision Support DB
Transfer Size: 1MB
Reads 100% Writes 0%
Random 100%
Boundry 4K Outstanding IO 64 Threads/Workers: 8
Mail Server
Transfer Size: 32K
Reads 58% Writes 42%
Random 95%
Boundry 4k Outstanding IO 64 Threads/Workers:8
Search Engine
Transfer Size:4K
Reads 100% Writes 0%
Random100%
Boundry 4K Outstanding IO 64 Threads/Workers:8
OS Paging
Transfer Size:64K
Reads 90% Writes 10%
Sequential 100%
Boundry 4K Outstanding IO 64 Threads/Workers:1
Digital Video Surveillance
Transfer Size:512K
Reads 90% Writes 10%
Sequential 100%
Boundry 512K Outstanding IO 64 Threads/Workers:8
Workstation
Transfer Size: 8K
Reads 80% Writes 20%
Random80%
Boundry 8K Outstanding IO 64 Threads/Workers 4

The DCP1000 provided some stunning numbers in these workload scenarios. The Video On Demand and Decision Support Database tests produced MB/s figures that surpassed the official top end figure of 6,800MB/s. The Video On Demand test produced a figure of 7,163MB/s while the Decision Support Database gave up a score of 7,143MB/s
 KitGuru KitGuru.net – Tech News | Hardware News | Hardware Reviews | IOS | Mobile | Gaming | Graphics Cards


Would it be possible to do game load times in benchmarks? Some engines, e.g. Frostbite, REDengine, RAGE, are extremely impacted by SSD/HDD performance so it’d be great to see how much of an impact such a product has on loading times.
What is the MTBF for this drive? Given the read write times. Normal day to day and say video editing on a daily basis?
“Stated endurance for the 1.6TB drive as a whole is 1820TB TBW with each of the 400GB drives rated at 375TB TBW”
Depends how much you write per day. 100GB/day would give an estimated 18200 days. 1TB/day would give an estimated 1820 days.
I’ve got a 950 Pro for close to 2 years, that’s now hit 40TB written (rated 400TBW), it’s used as a buffer drive for recordings, temp drive, and to store games on.
I’ve also got a 960 Evo, had it for about a year, is only used for OS and smaller apps like office / photoshop etc, that’s now at 6.8TB written, (rated 100TBW).
Edit: also both drives have only gone down to 99% drive life remaining according to SMART, despite having used 10% and 6.8% of their rated writes. Google the ssd endurance test, some drives almost made 2000 TBW before failing outright, and thats a few years old.
Edit edit: have a look at this;
http://www.guru3d.com/news-story/endurance-test-of-samsung-850-pro-comes-to-an-end-after-9100tb-of-writes.html
That would be interesting to see, especially with comparisons against other drives in similar raid arrays as this raid on card