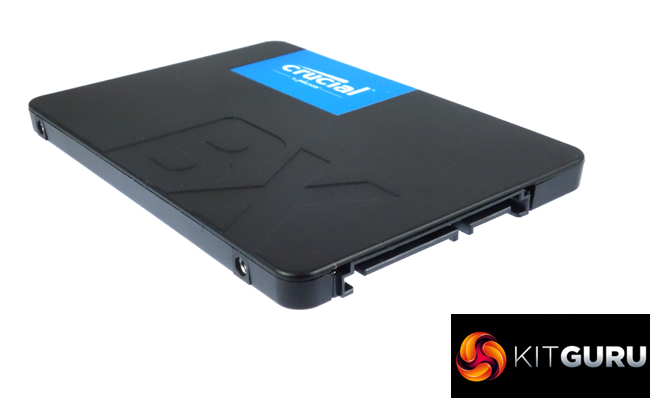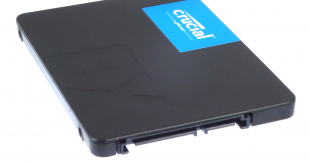
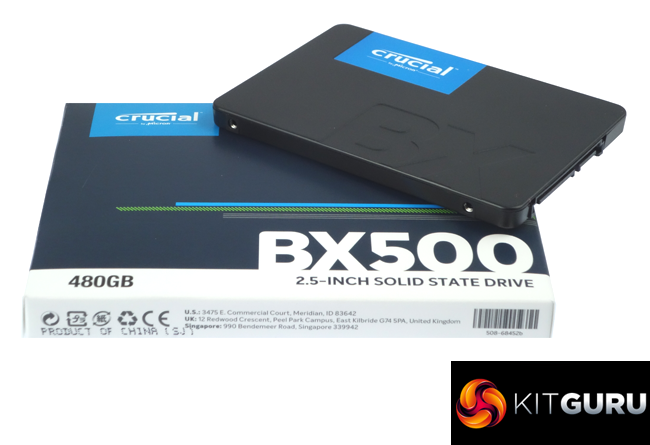
Launched without much fanfare or fuss, Crucial's BX500 is the company's latest addition to the entry-level BX series. To make the drive as competitive as possible in this cut-throat end of the market, the BX500 doesn't have a dedicated cache chip and has a thin plastic case.
The Crucial BX500 product line consists of three capacities; 120, 240 and 480GB and its the flagship 480GB drive we are looking at today. At the heart of the BX500 is a Silicon Motion SM2258XT four channel controller combined with Micron's 64-layer 3D TLC NAND and to keep costs at a minimum it's a DRAM-less design.
All three drives have the same Sequential performance figures; 540MB/s for reads and 500MB/s for writes although Crucial haven't disclosed any random read/write performance figures for the drive which is a bit odd.
The endurance rating for the drive is just 120TB TBW which works out at around 109GB a day for the length of the 3-year warranty Crucial back the drive with.
Physical Specifications:
Usable Capacities: 480GB
NAND Components: Micron 64-layer 3D TLC NAND
NAND Controller: Silicon Motion SM2258XT
Cache: none
Interface: Serial ATA (SATA) 6Gb/s (SATA III)
Form Factor: 2.5in, 7mm
Dimensions: 100.3 x 69 x 7mm
Drive Weight: 60g
Firmware Version: M6CR013
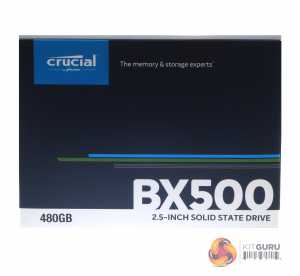
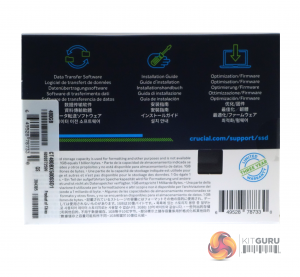
The drive comes in a box without any image on the drive on the front or back. On the bottom left hand side of the box front is the drives capacity. The rear of the box has three icons for Data Transfer Software (Acronis True Image HD 2015), Installation Guide and Firmware update which are all available via Crucial's SSD support web page.
The only thing in the box beside the drive is a setup / warranty information pamphlet.
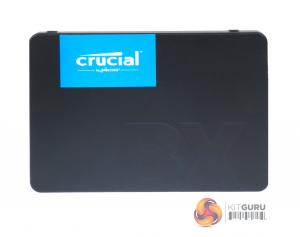
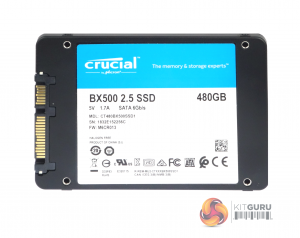
The BX500 is built on a standard 2.5in, 7mm format in a plastic enclosure.
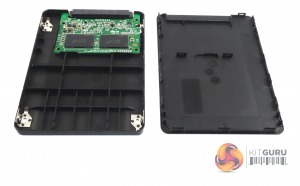
The thin plastic enclosure is held together by clips but thoughtfully Crucial have strengthened the area where the mounting screws locate with small metal plates.
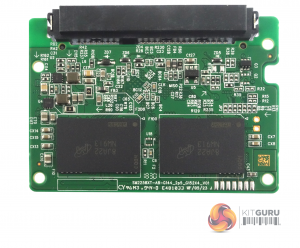
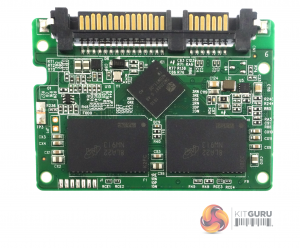
Inside the 480GB drive is a tiny PCB, just big enough to hold all the components. One side of the board holds two packages of Micron 64-layer 3D TLC NAND. When the chips FBGA code of NW913 is put into Microns part decoder we get a part code of MT29F1T08EMHAFJ4-3R:A, which are 1Tbit (128GB) packages. The other side of the board holds another pair of NAND packages and the Silicon Motion SM2258XT controller.
The XT version of Silicon Motion's four channel SM2258 controller supports DRAM-less drive designs. The controller uses a 32-bit RISC CPU, supports 1z nm 3D NAND and uses Silicon Motion's proprietary NANDXtend error-correcting code (ECC) technology.
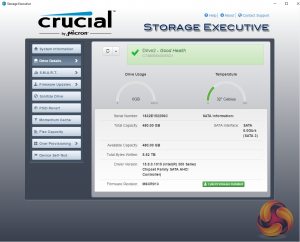
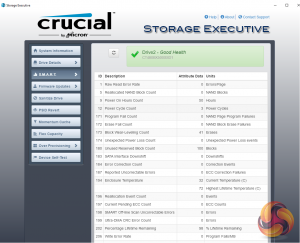
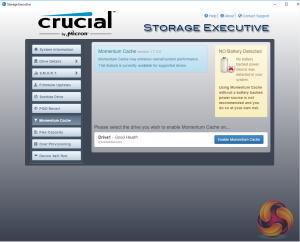
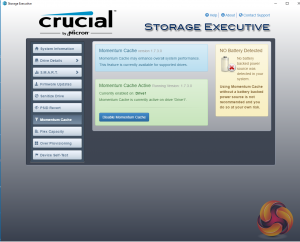
Crucial's Storage Executive is a pretty comprehensive SSD toolkit. With it you can check the drive’s S.M.A.R.T data, update the firmware, see how the drive’s capacity is being used, monitor the drive’s operating temperature and overall health, reset the PSID (if supported), sanitize the drive, adjust the Over Provisioning and enable the Momentum Cache feature.
For testing, the drives are all wiped and reset to factory settings by HDDerase V4. We try to use free or easily available programs and some real world testing so you can compare our findings against your own system. This is a good way to measure potential upgrade benefits.
Main system:
Intel Core i7-7700K with 16GB of DDR4-3200 RAM, Sapphire R9 390 Nitro and an Asus Prime Z270-A motherboard.
Other 480GB class drives:
Corsair Neutron XTi 480GB
Crucial BX300 480GB
Intel SSD730 480GB
Kingston HyperX Fury RGB 480GB
Kingston HyperX 3K 480GB
OCZ Trion 100 480GB
OCZ Trion 150 480GB
Patriot Ignite 480GB
PNY CS2111 XLR8 480GB
Samsung 840DC EVO 480GB
Samsung 840DC PRO 400GB
SanDisk Extreme Pro 480GB
Seagate 600 480GB
Transcend SSD220S 480GB
Software:
Atto Disk Benchmark.
CrystalMark 3.0.3.
AS SSD.
IOMeter.
Futuremark PC Mark 8
All our results were achieved by running each test five times with every configuration this ensures that any glitches are removed from the results. Trim is confirmed as running by typing fsutil behavior query disabledeletenotify into the command line. A response of disabledeletenotify =0 confirms TRIM is active.
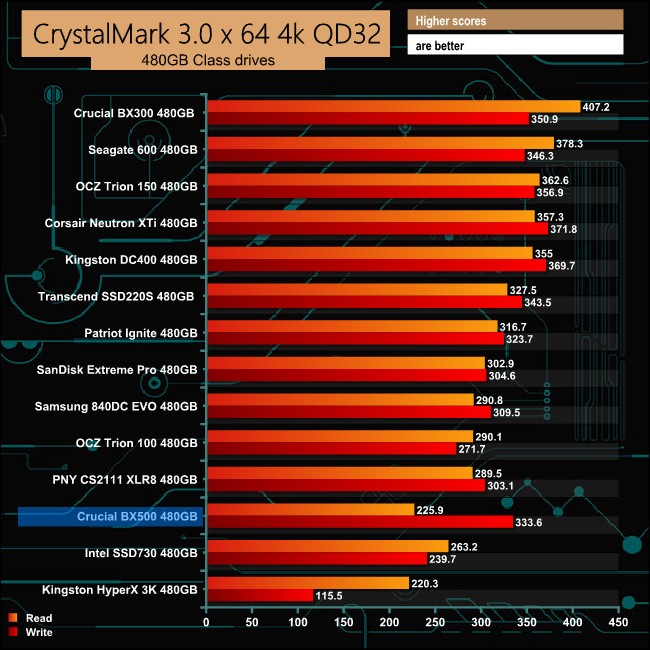
CrystalDiskMark is a useful benchmark to measure theoretical performance levels of hard drives and SSD’s.
We are using V3.0.3.
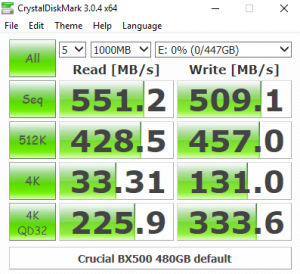
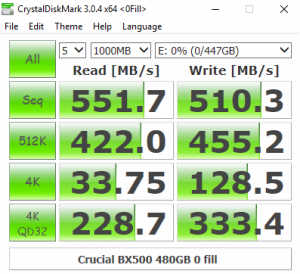
Crucial's BX500 is not the fastest when it comes to handling small bity files at a deepish queue depths although having said that the write performance is better than the read. Looking at the result screens it seems the Silicon Motion SM2258XT controller doesn't have a preference on what type of data it is handling
The ATTO Disk Benchmark performance measurement tool is compatible with Microsoft Windows. Measure your storage systems performance with various transfer sizes and test lengths for reads and writes. Several options are available to customize your performance measurement including queue depth, overlapped I/O and even a comparison mode with the option to run continuously.
Use ATTO Disk Benchmark to test any manufacturers RAID controllers, storage controllers, host adapters, hard drives and SSD drives and notice that ATTO products will consistently provide the highest level of performance to your storage.
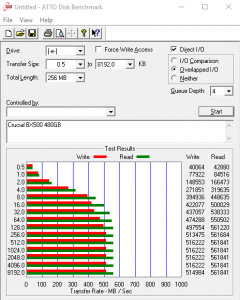
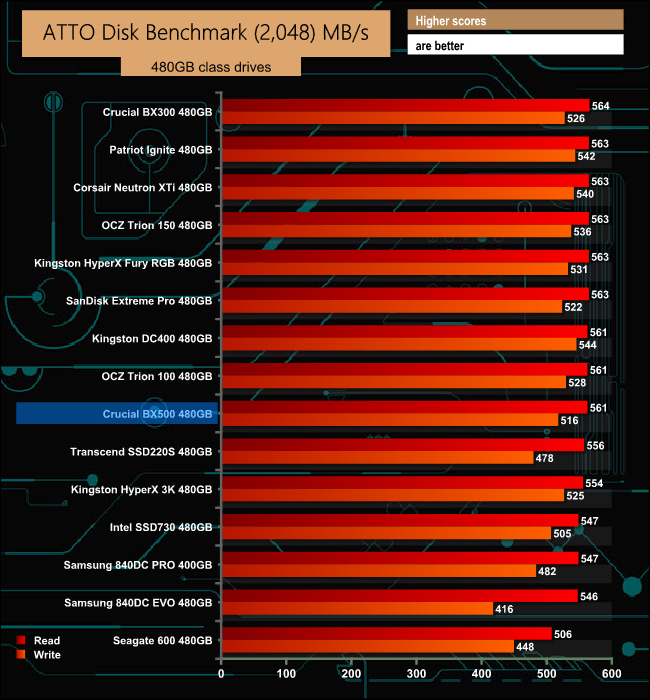
Crucial's official Sequential performance numbers for the 480GB BX500 are up to 540MB/s for reads and 500MB/s for writes. Using the ATTO benchmark to test the drive we managed to prise a little more out of the drive with a figure of 561MB/s for reads and 516MB/s for writes.
AS SSD is a great free tool designed just for benching Solid State Drives. It performs an array of sequential read and write tests, as well as random read and write tests with sequential access times over a portion of the drive. AS SSD includes a sub suite of benchmarks with various file pattern algorithms but this is difficult in trying to judge accurate performance figures.
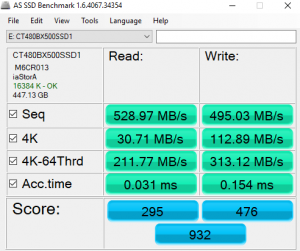
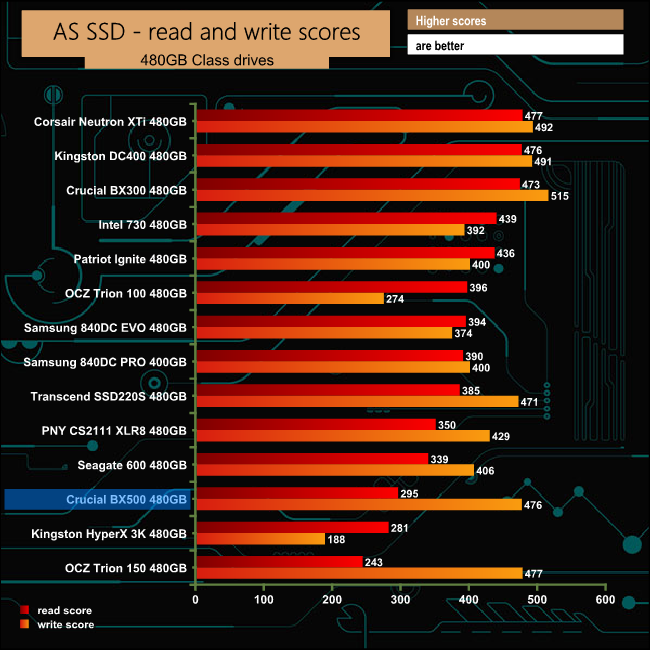
Although the BX500 won't win any prizes for read performance in the AS SSD benchmark, the write score of 476 is very good for this class of SATA based SSD.
IOMeter is another open source synthetic benchmarking tool which is able to simulate the various loads placed on hard drive and solid state drive technology.
We test with both random read and write 4k tests, as shown above. There are many ways to measure the IOPS performance of a Solid State Drive, so our results will sometimes differ from manufacturer’s quoted ratings. We do test all drives in exactly the same way, so the results are directly comparable.
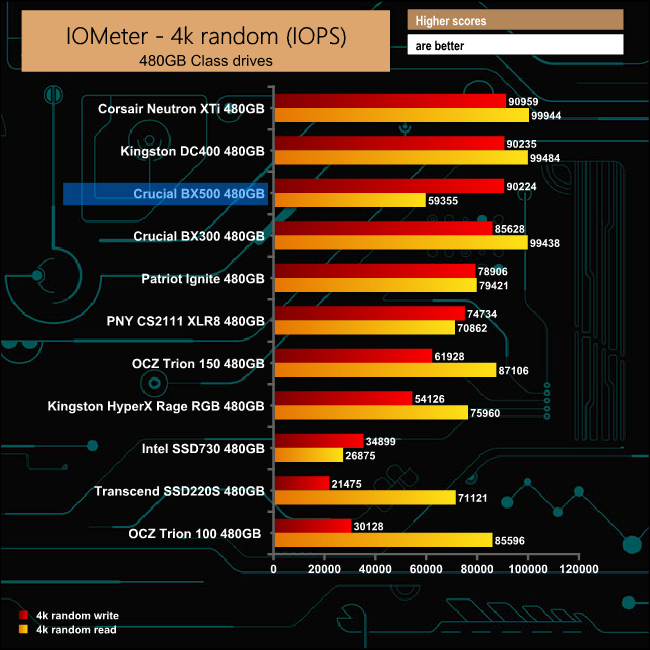
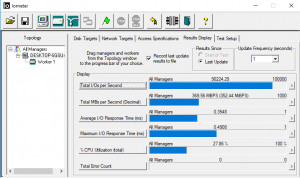
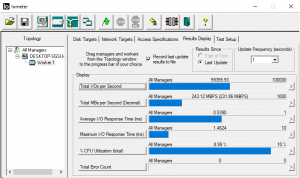
When dealing with random 4K data the BX500 drive get a healthy boost in write performance from the dynamic SLC buffer that Crucial have used to improve performance.
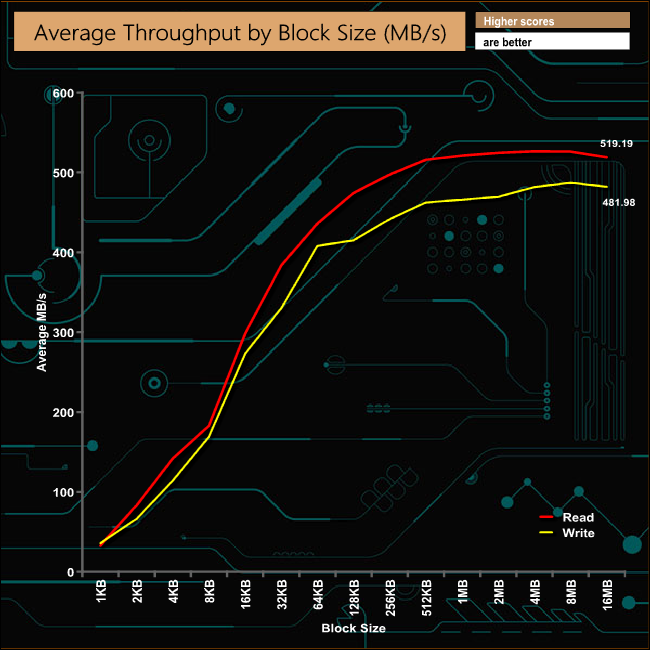
Peak read performance came at the 8MB block size in our throughput test at 525.61MB/s before dropping back to finish the test at 519.19MB/s. The best write figure came at the 4MB block mark at 487.18MB/s before dropping back slightly to 481.98MB/s at the end of the test.
Futuremark’s PCMark 8 is a very good all round system benchmark but it’s Storage Consistency Test takes it to whole new level when testing SSD drives. It runs through four phases; Preconditioning, Degradation, Steady State, Recovery and finally Clean Up. During the Degradation, Steady State and Recovery phases it runs performance tests using the 10 software programs that form the backbone of PCMark 8; Adobe After Effects, Illustrator, InDesign, Photoshop Heavy and Photoshop Light, Microsoft Excel, PowerPoint, Word, Battlefield 3 and World of Warcraft. With some 18 phases of testing, this test can take many hours to run.
Preconditioning
The drive is written sequentially through up to the reported capacity with random data, write size of 256 × 512 = 131,072 bytes. This is done twice.
Degradation
Run writes of random size between 8 × 512 and 2048 × 512 bytes on random offsets for 10 minutes. It then runs a performance test. These two actions are then repeated 8 times and on each pass the duration of random writes is increased by 5 minutes.
Steady State
Run writes of random size between 8 × 512 and 2048 × 512 bytes on random offsets for final duration achieved in degradation phase. A performance test is then run. These actions are then re-run five times.
Recovery
The drive is idled for 5 minutes. Then a performance test is run. These actions are then repeated five times.
Clean Up
The drive is written through sequentially up to the reported capacity with zero data, write size of 256 × 512 = 131,072 bytes.
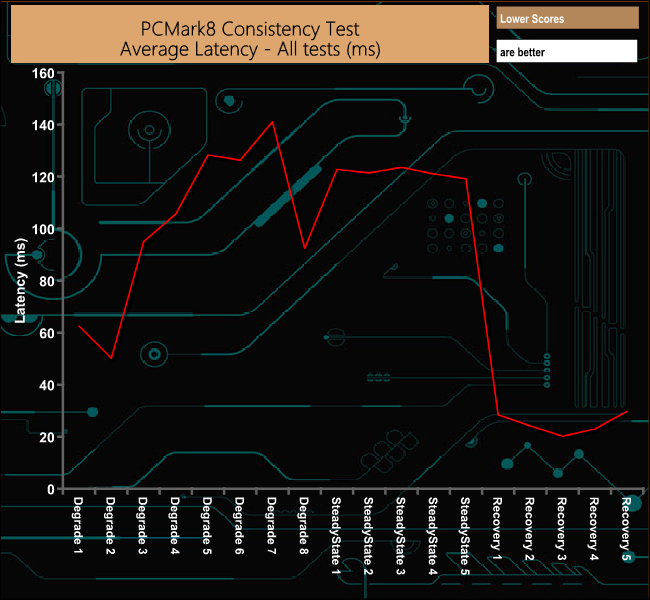
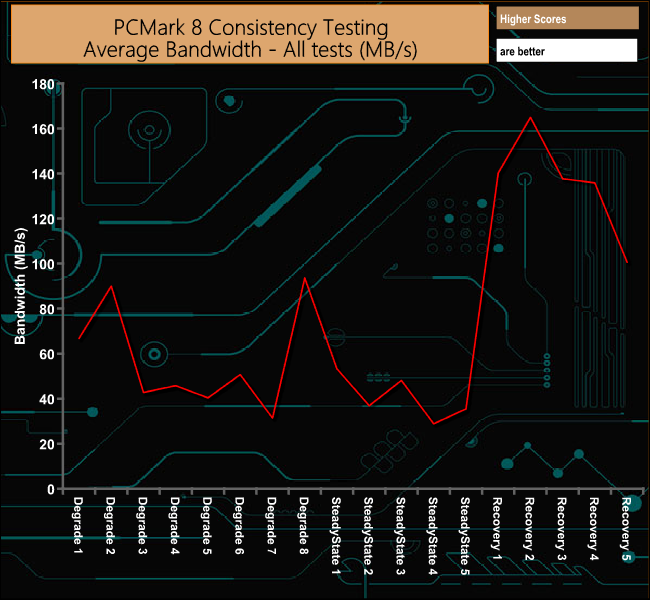
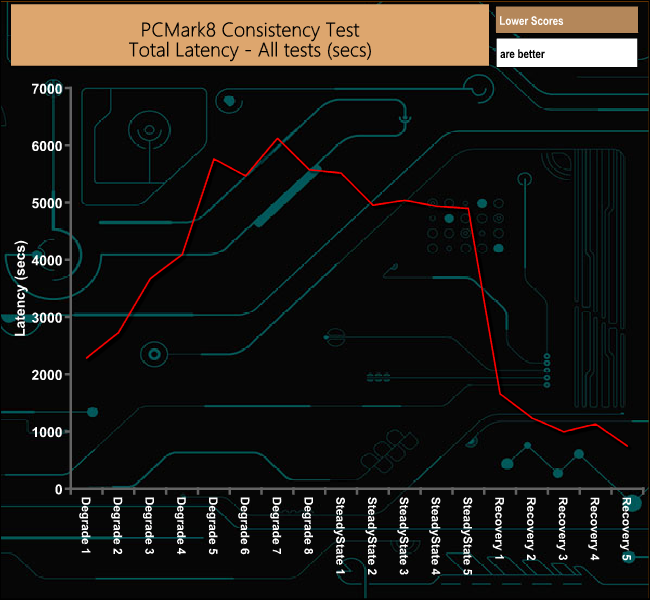
Overall the 480GB BX500 struggles with the PCM8 Consistency test with quite low bandwidth figures. It starts to recover well during the first two recovery phases but then the performance drops off.
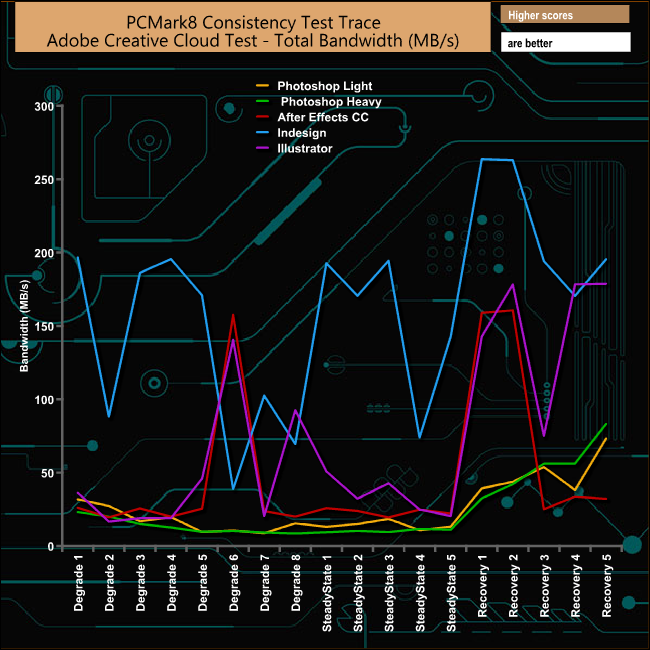
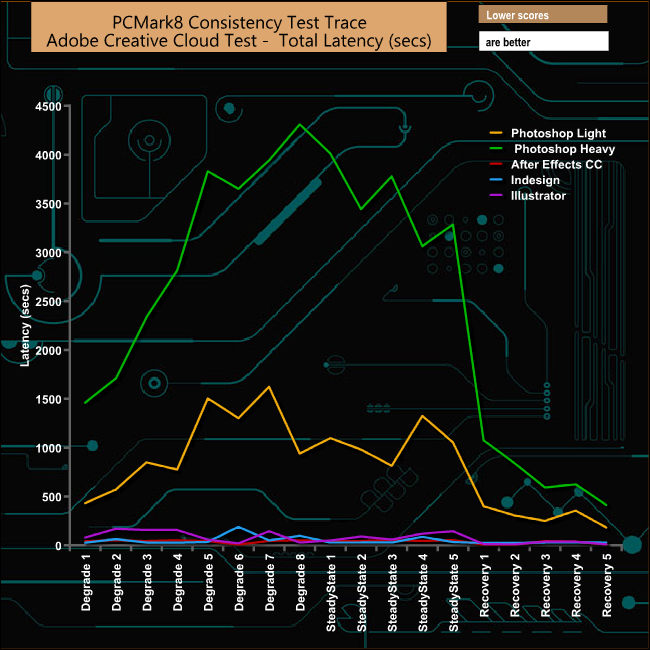
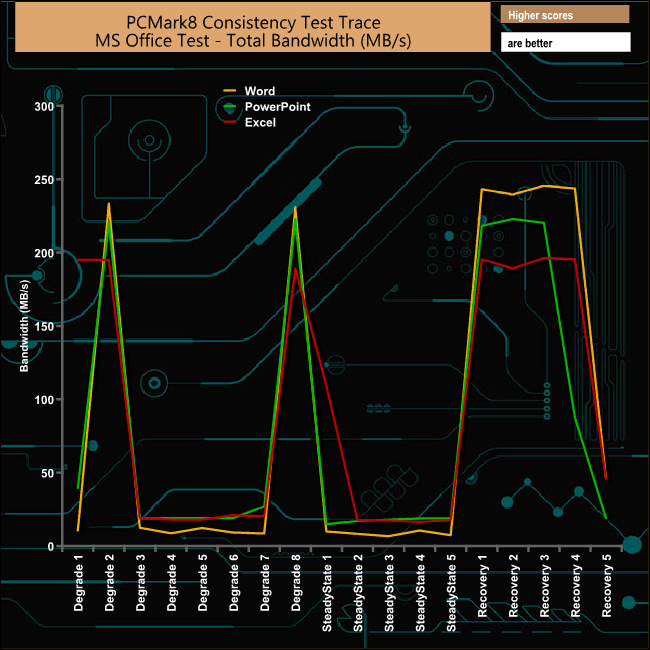
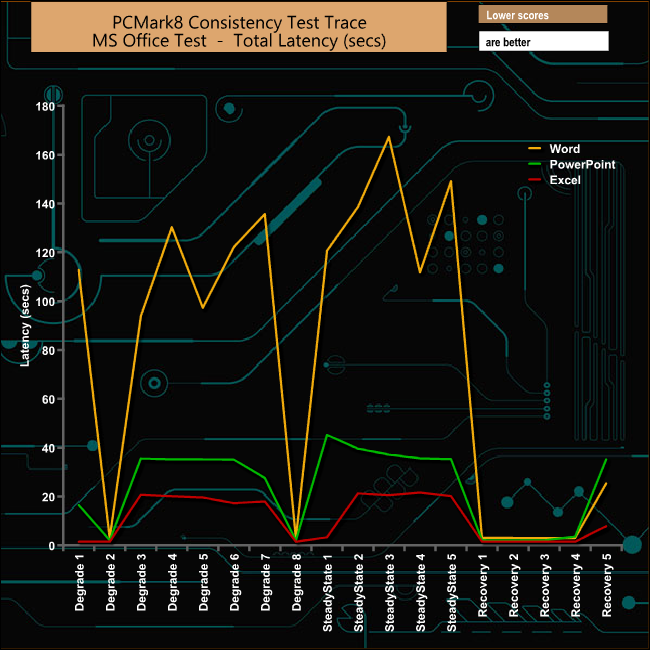
PCMark 8’s Consistency test provides a huge amount of performance data, so here we’ve looked a little closer at how the BX500 performs in each of the benchmarks test suites.
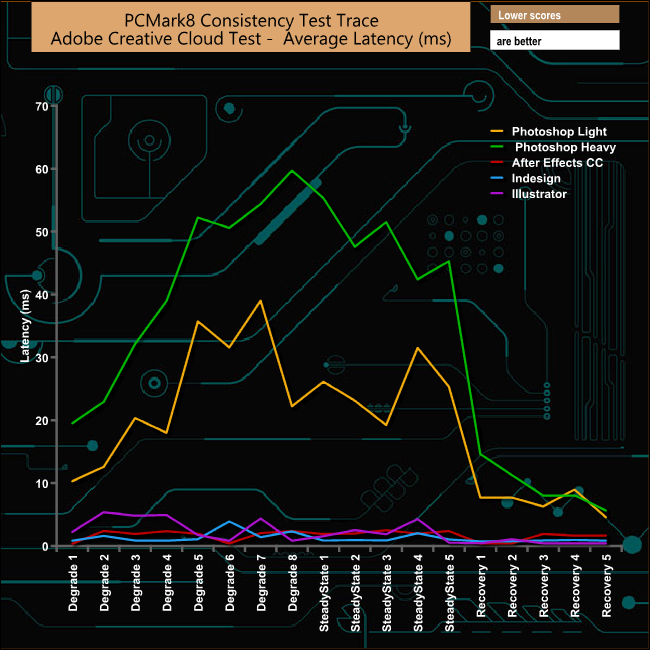
The drive takes a pounding during the Photoshop Heavy and Light tests and the recovery phases for both test traces are somewhat erratic. The drive handles the Adobe InDesign trace the best of all but even here there are some dramatic plunges in bandwidth during the Degradation and Steady State phases.
Microsoft Office
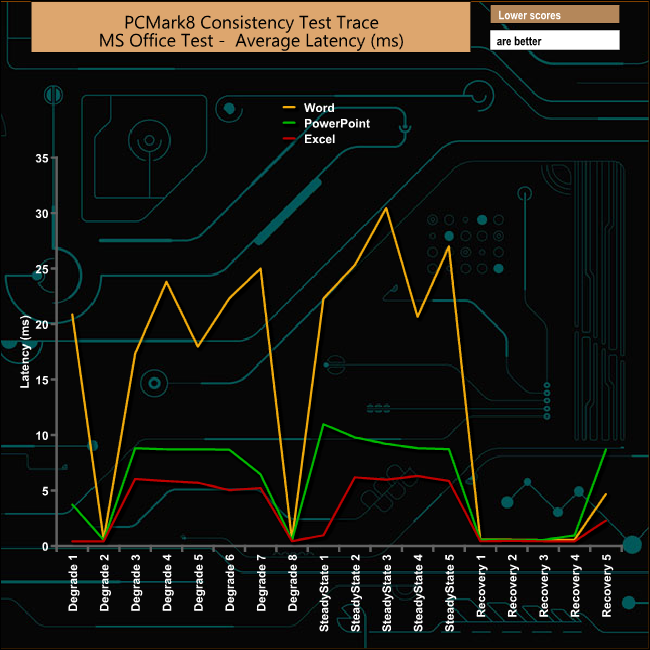
The BX500 really struggles with the Word trace in the MS Office tests and the recovery phases for all of the three Office tests sees bandwidths falling off a cliff by the end of the test.
Casual Gaming
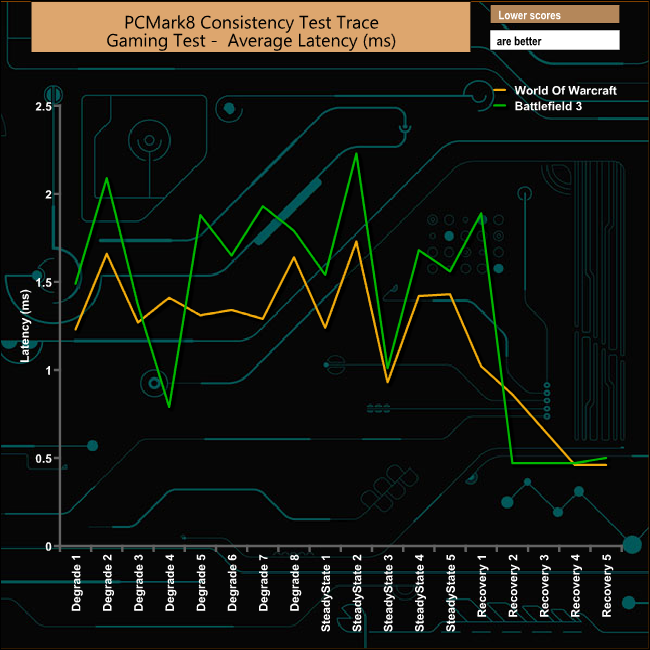
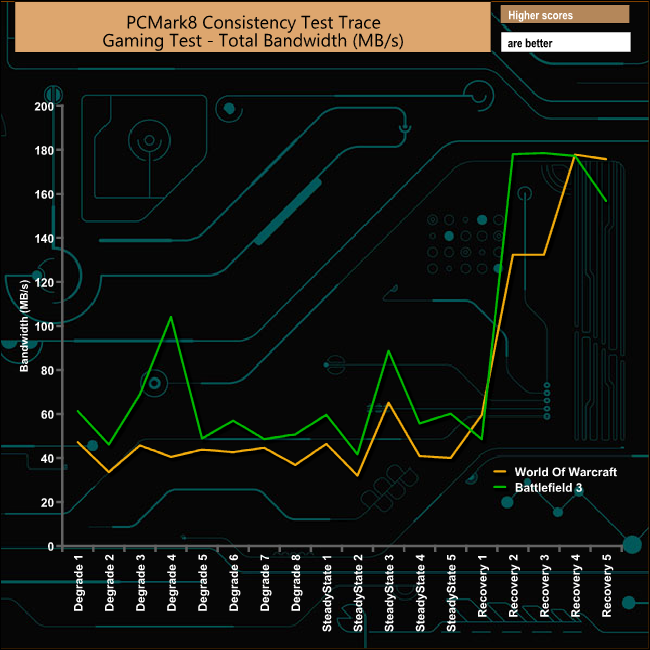
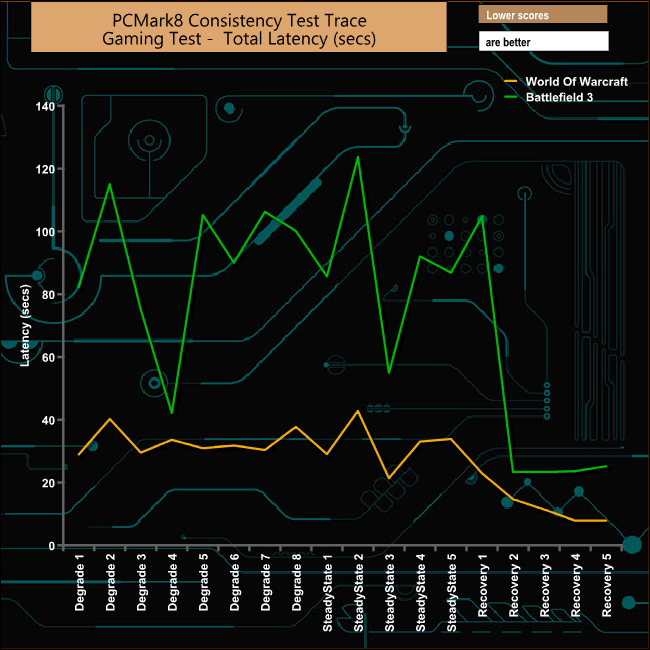
Although the drive gets hit quite hard during both casual gaming tests it does recover very well indeed. The best performance in the recovery phases comes from the Battlefied 3 trace.
Just like the Consistency test, PCMark 8’s Standard Storage test also saves a large amount of performance data. The default test runs through the test suite of 10 applications three times. Here we show the total bandwidth performance for each of the individual test suites for the third and final benchmark run.
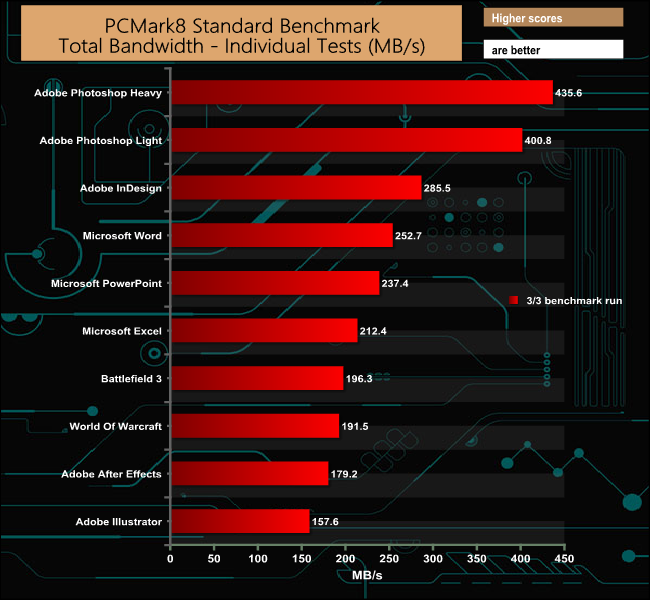
The BX500 makes a pretty good job of the standard PCMark 8 Storage Test, with strong bandwidth figures for the two Adobe Photoshop tests producing 435.6MB/s for the Photoshop Heavy test and 400.8 for the Photoshop Light test run.
To test real life performance of a drive we use a mix of folder/file types and by using the FastCopy utility (which gives a time as well as MB/s result) we record the performance of drive reading from & writing to a 256GB Samsung SSD850 PRO.
100GB data file.
60GB iso image.
60GB Steam folder – 29,521 files.
50GB File folder – 28,523 files.
12GB Movie folder – 24 files (mix of Blu-ray and 4K files).
10GB Photo folder – 621 files (mix of .png, raw and .jpeg images).
10GB Audio folder – 1,483 files (mix of mp3 and .flac files).
5GB (1.5bn pixel) photo.
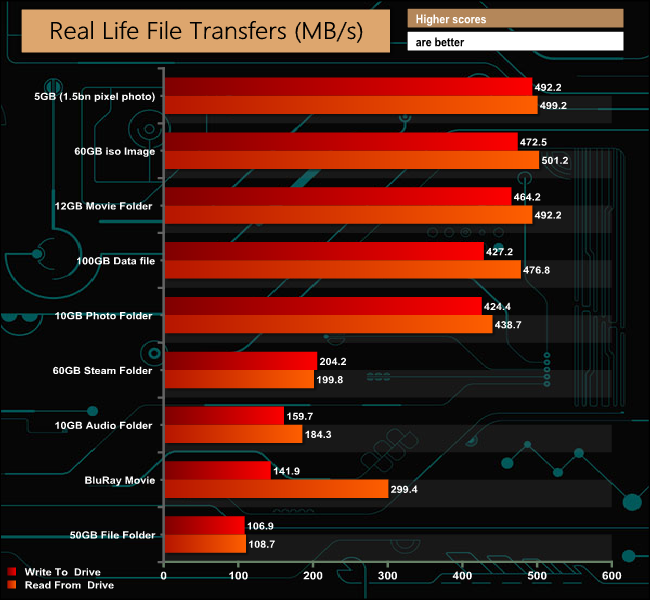
The BX500 had no problems with our real life file transfer tests getting well over 400MB/s for all the larger file size tests but it didn't handle the smaller bity files of the 50GB file folder anywhere near as well.
Crucial’s Momentum Cache technology is an intelligent software driver that dynamically leverages unused system memory to enhance burst performance and to overcome the fact that SSDs typically have better read performance that write. Momentum Cache will use up to 25% of available system memory, though no more than 4GB. Control over turning the technology on or off lies in Crucial's Storage Executive utility.
Whenever the OS needs to write data to the Crucial SSD, the data is actually written to the portion of the memory being used by the Momentum software instead, which is much quicker. Afterwards, the data is flushed to the SSD for permanent storage.
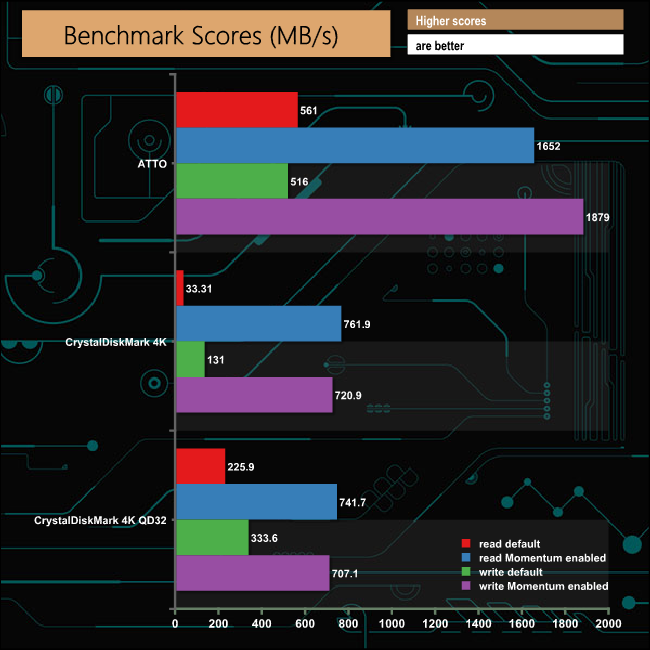
As you can see, turning on the Momentum Cache has a stunning effect on benchmark scores but not only writes, reads get a massive boost too, especially 4K reads. The Sequential read/write performance of the drive when the Momentum technology is applied is stunning with reads jumping from 561MB/s to 1,652MB/s and writes rocketing from 516MB/s to 1,879MB/s in the ATTO benchmark.
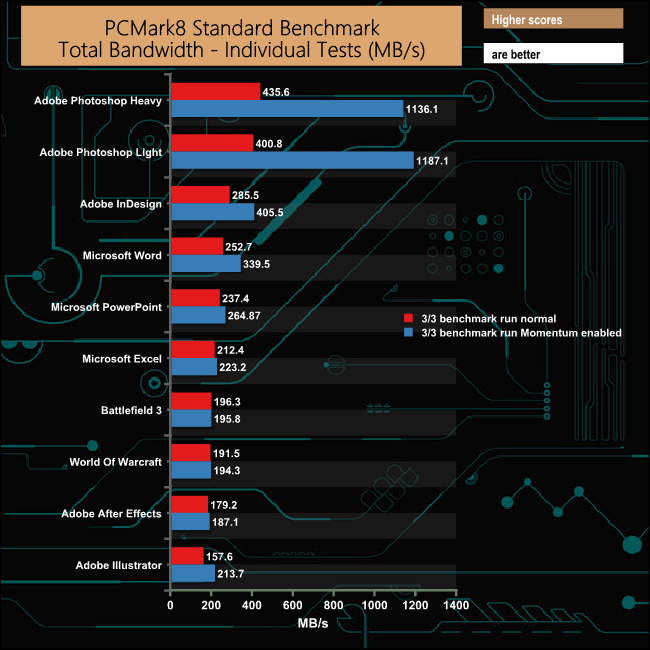
The only two tests in the third and final run of the standard PCM8 Storage Test to get a real boost from the technology are the two most demanding Adobe Photoshop ones. The bandwidth rockets from 400.8MB/s to 1,187.11MB/s in the Photoshop Light test and from 435.6MB/s up to 1136.1MB/s for the Photoshop Heavy trace. The Adobe InDesign, Word and PowerPoint tests all get a boost but nowhere near as much as the two Photoshop tests.
So the Momentum Cache gives benchmarks a real boost up to some impressive levels. But how about real life situations.
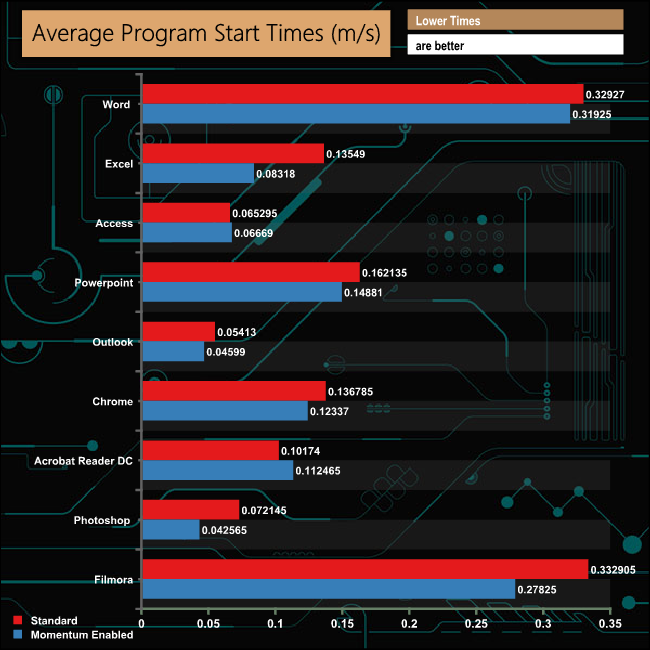
We used a variety of different applications and measured their load times to see if the Momentum Cache made any difference. The short answer is no, not really. In fact as we’re talking milliseconds, you won’t notice the difference if there is any advantage.
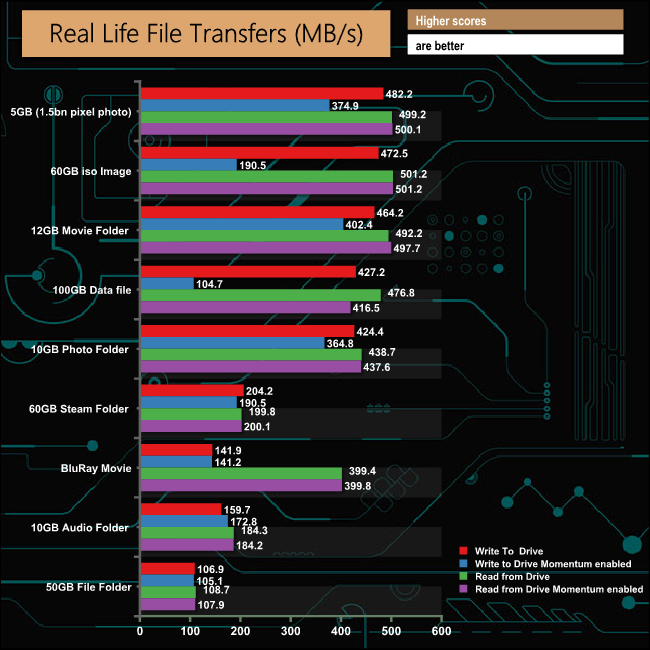
It’s much the same story with the real life file transfers, the Momentum technology making not much difference and in the case of the 60GB iso and 100GB data file transfers actually making the transfer a lot slower.
Crucial once reigned supreme in the entry-level SSD market segment but this a segment that has become ferociously competitive so to give the Crucial BX500 a fighting chance, Crucial have gone all out to keep the cost of building the drive as low as possible. It's a DRAM-less design which saves money but at the expense of some performance and it is housed in a thin plastic chassis, not the usual metal one.
The drive uses Silicon Motion's SM2258XT four channel controller which has been designed to work with DRAM-less SSD designs in combination with Micron's own 64-layer 3D TLC NAND.
To try and get over some of the write performance issues with DRAM-less designs the BX500 uses Crucial's Dynamic Write Acceleration technology. DWA technology allows a SSD controller to dynamically switch Flash modes from, in this case from TLC to SLC and back again.
Crucial have only released sequential performance figures for the BX500 series and they are what you would expect from a SATA based drive with 3D TLC NAND and a four channel controller; up to 540 MB/s reads and 500 MB/s for writes for all three drives in the product line. Testing the drive with the ATTO benchmark we squeezed a bit more Sequential performance out of the 480GB drive, getting a read figure if 561 MB/s while writes achieved 512 MB/s.
Even though Crucial have given the 480GB BX500 a competitive price tag of around £70 when launched, it still would benefit from a price reduction. This particular market segment has better performing drives including the 480GB version of Toshiba's TR200 and even Crucial's own 500GB MX500 which is only a fiver more expensive and is not only faster, it comes with a five year warranty.
We found the 480GB Crucial BX500 on M2M Direct for £69.95 (inc VAT) HERE
Pros
- Strong Sequential performance.
- Price.
- Crucial Storage Executive software.
Cons
- DRAM-less design does affect performance.
Kitguru says: If you are on a very tight budget and need a 480GB SSD then Crucial's BX500 is an obvious choice but and it's a big but, there are much better-performing drives on the market for not very much more money including one from Crucial themselves.
 KitGuru KitGuru.net – Tech News | Hardware News | Hardware Reviews | IOS | Mobile | Gaming | Graphics Cards
