Saying that Corsair's SSD department has been rather quiet since the launch of the Force MP500 is a bit of an understatement, but now they are back with a bang in the shape of the Force MP510, a powerful follow up to the MP500.
The Force MP510 product line is (at the time of writing) made up of three capacities; 240GB, 480GB and 960GB with a flagship 1,920GB coming very soon. The 240GB and 480GB drives are built on a single sided M.2 2280 format while the 960GB and 1,920GB models use both sides of the PCB to house components.
Whereas the MP500 used a combination of the first gen Phison E7 NVMe controller and 2D MLC NAND, the MP510 is a bang up to date using the latest Phison PS5012-E12 8-channel controller to look after Toshiba 64-layer BiCS3 3D TLC NAND.
Quoted Sequential performance figures for the 960GB drive are up to an impressive 3,480MB/s for reads and up to 3,000MB/ for writes. The 480GB and 1,920GB drives have the same read figure while the 240GB drive sees the figure drop to up to 3,100 MB/s. The Sequential write performance of the family peaks at the 960GB drive's 3,000MB/s. The 1,920GB drive sees the write figure drop to 2,700MB/s while the 240GB and 480GB drives are rated at up to 1,050MB/s and 2,000MB/s respectively.
The official random read/write figures for the 980GB drive are equally as impressive, the drive rated at up to 610,000 IOPS for reads and up to 570,000 IOPS for writes. Again these are peak numbers for the family as the 1,920GB drive delivers up to 485,000 IOPS for reads and 530,000 IOPS for writes, while the 280GB drive is rated at 180,000 IOPS and 240,000 IOPS for read and writes respectively. The 480GB model is rated at up to 360,000 IOPS for reads and 440,000 IOPS for writes.
The rated TBW endurance figure for the 960GB MP510 is 1,700 TBW and Corsair back the drive with a 5-year warranty.
Physical Specifications:
Usable Capacities: 960GB
NAND Components: Toshiba 64-layer 256Gb BiCS3 3D TLC NAND
NAND Controller: Phison PS5012-E12
Cache: SK hynix DDR4
Interface: NVMe 1.3 PCIe Gen3.1 x4
Form Factor: M.2 2280
Dimensions: 80 x 20 x 3mm
Firmware Version: ECFM11.0
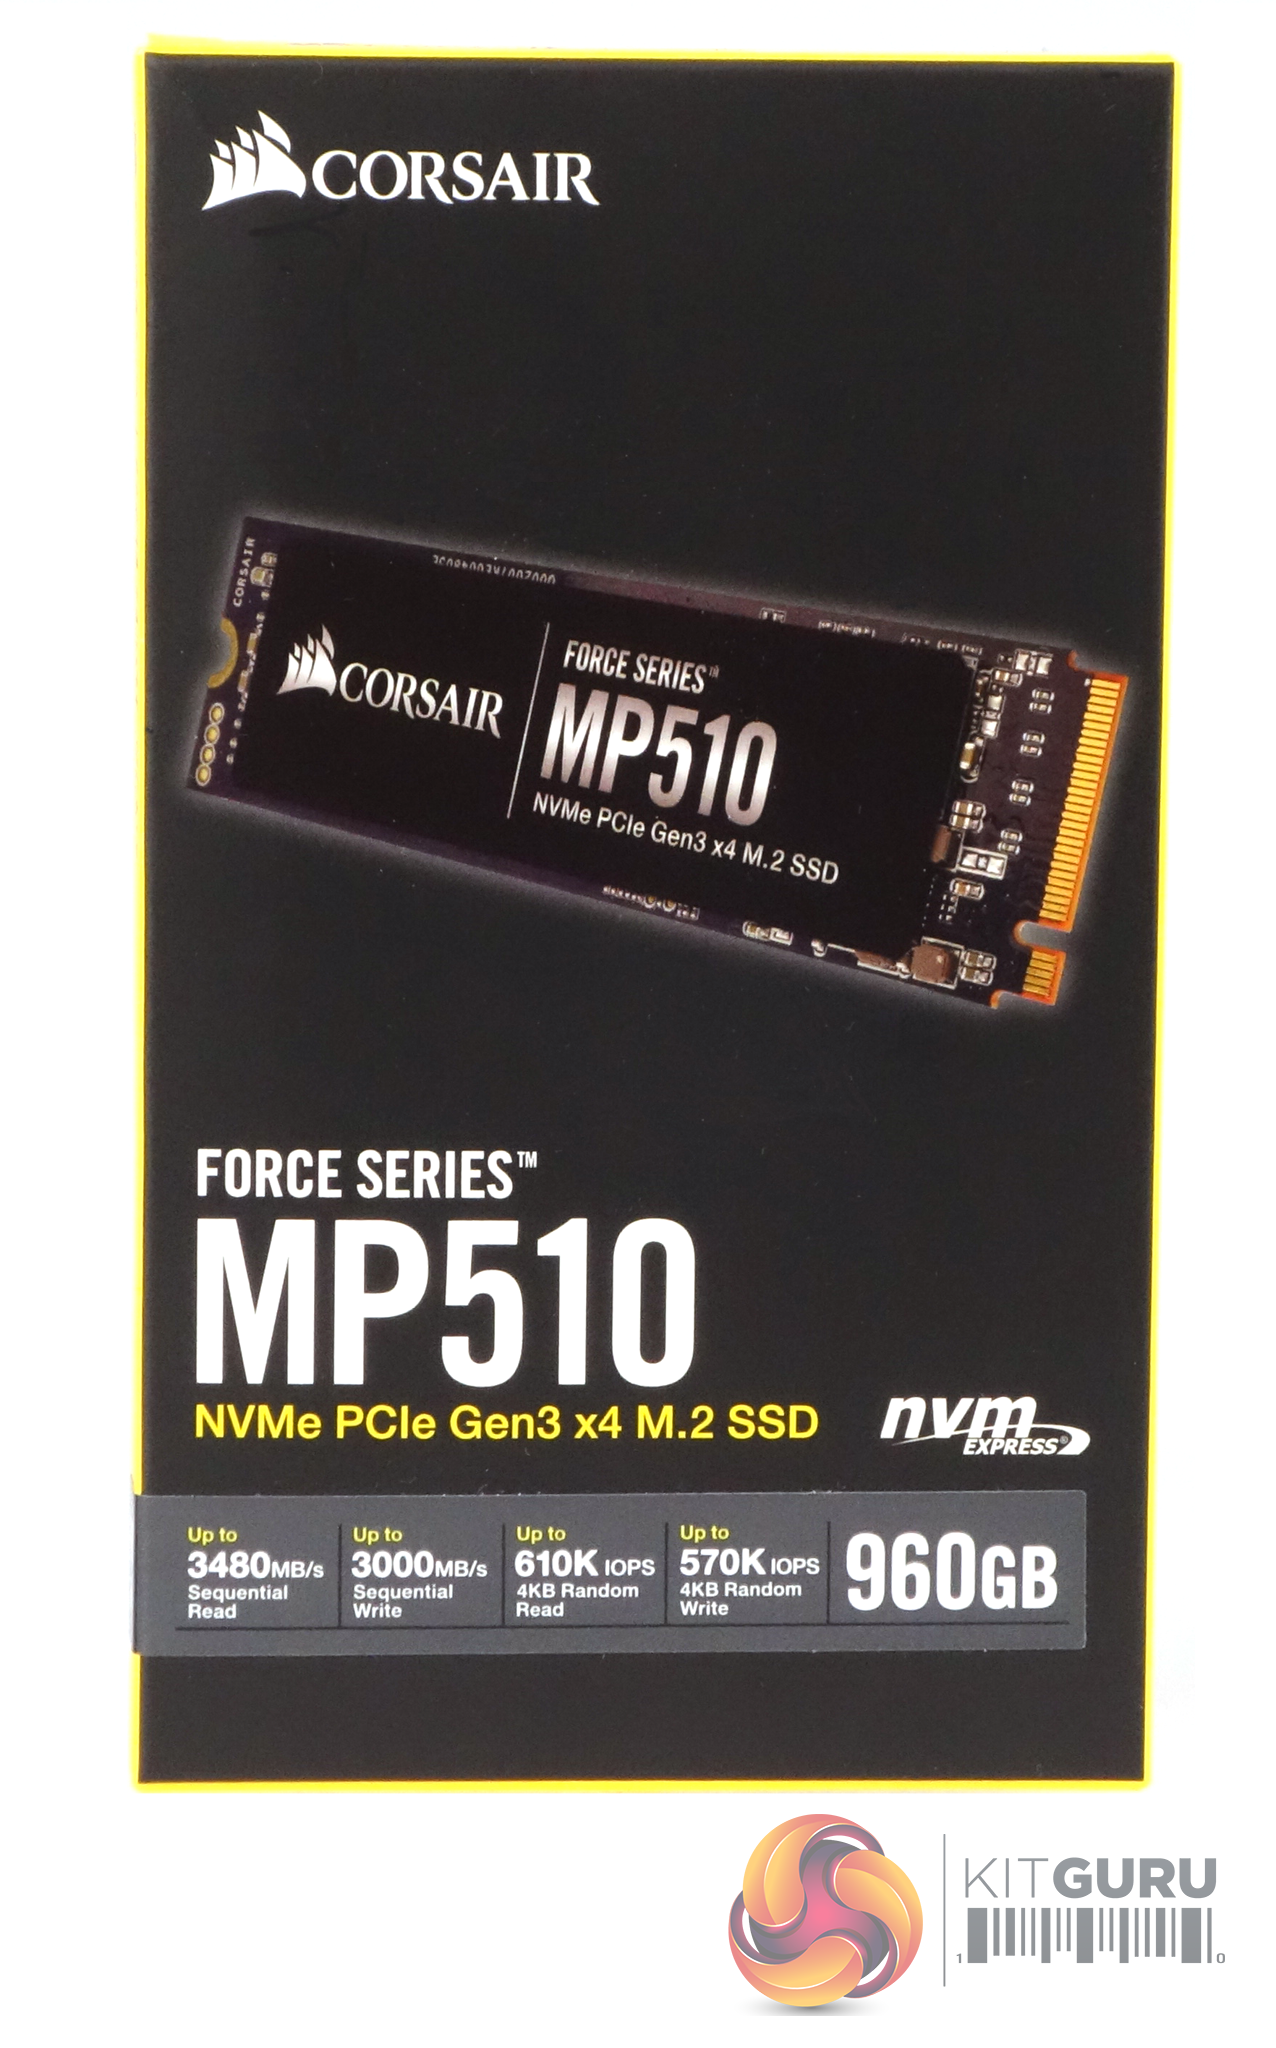
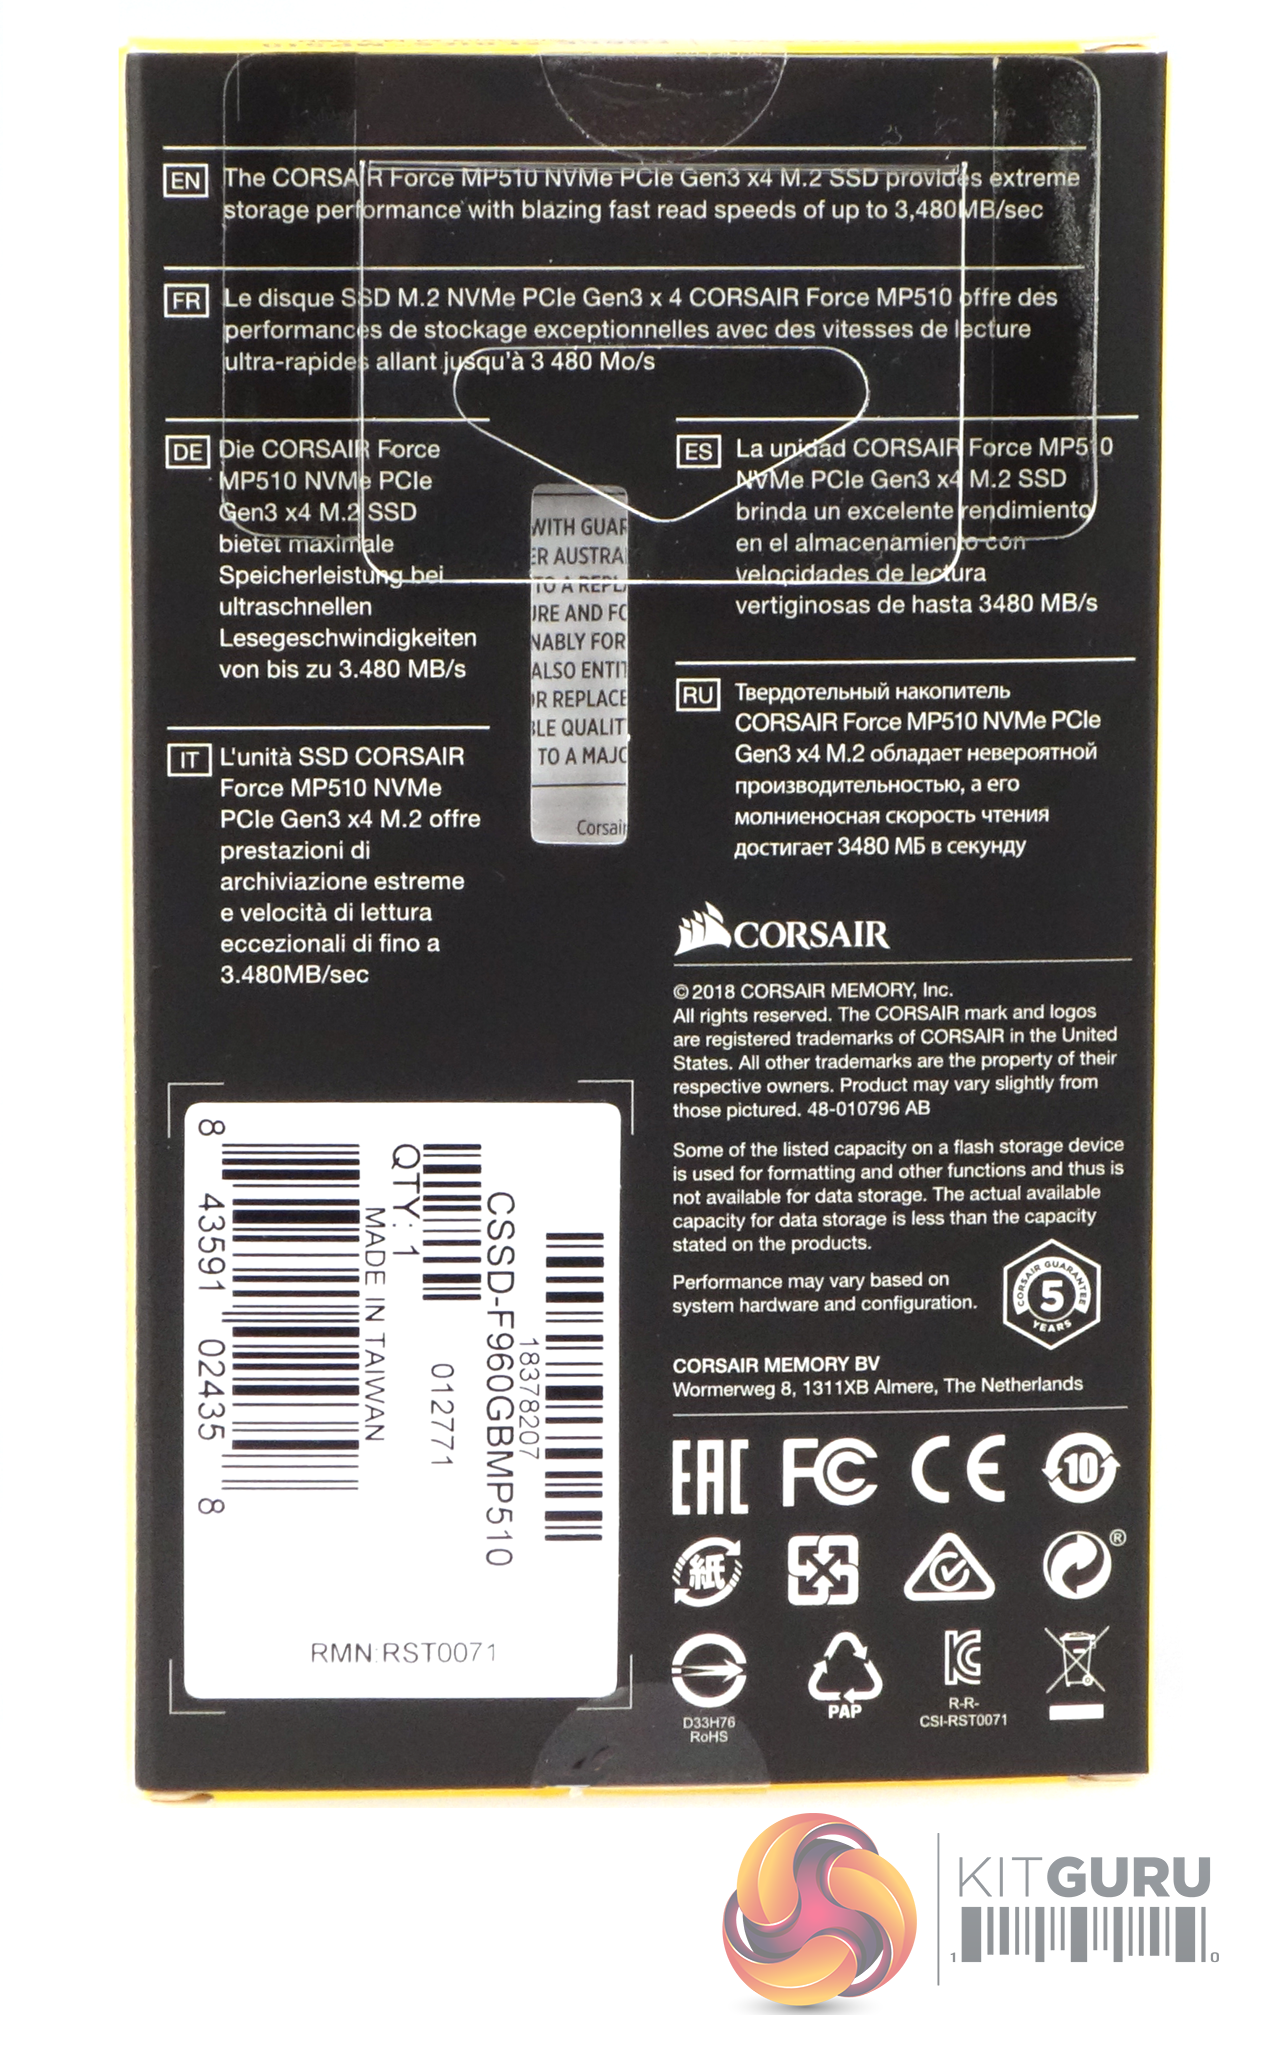
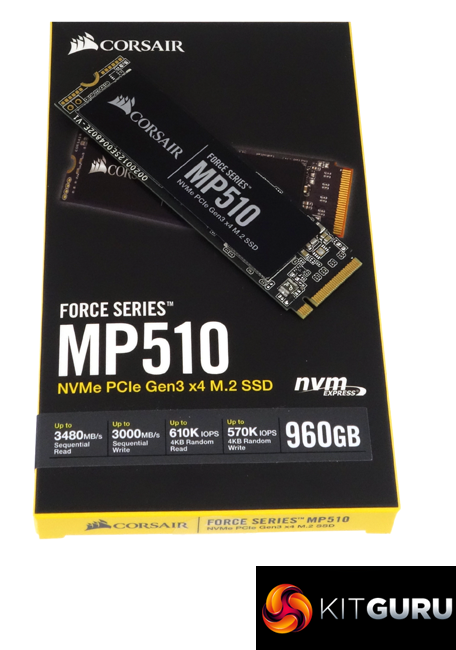
The MP510 comes in an attractive slim box, finished in black and yellow with an image of the drive on the front. Along with that image, there is also a panel that gives the drive’s capacity along with figures for Sequential and 4K random read/write performance. Most of the rear of the box is taken up by multilingual marketing text.
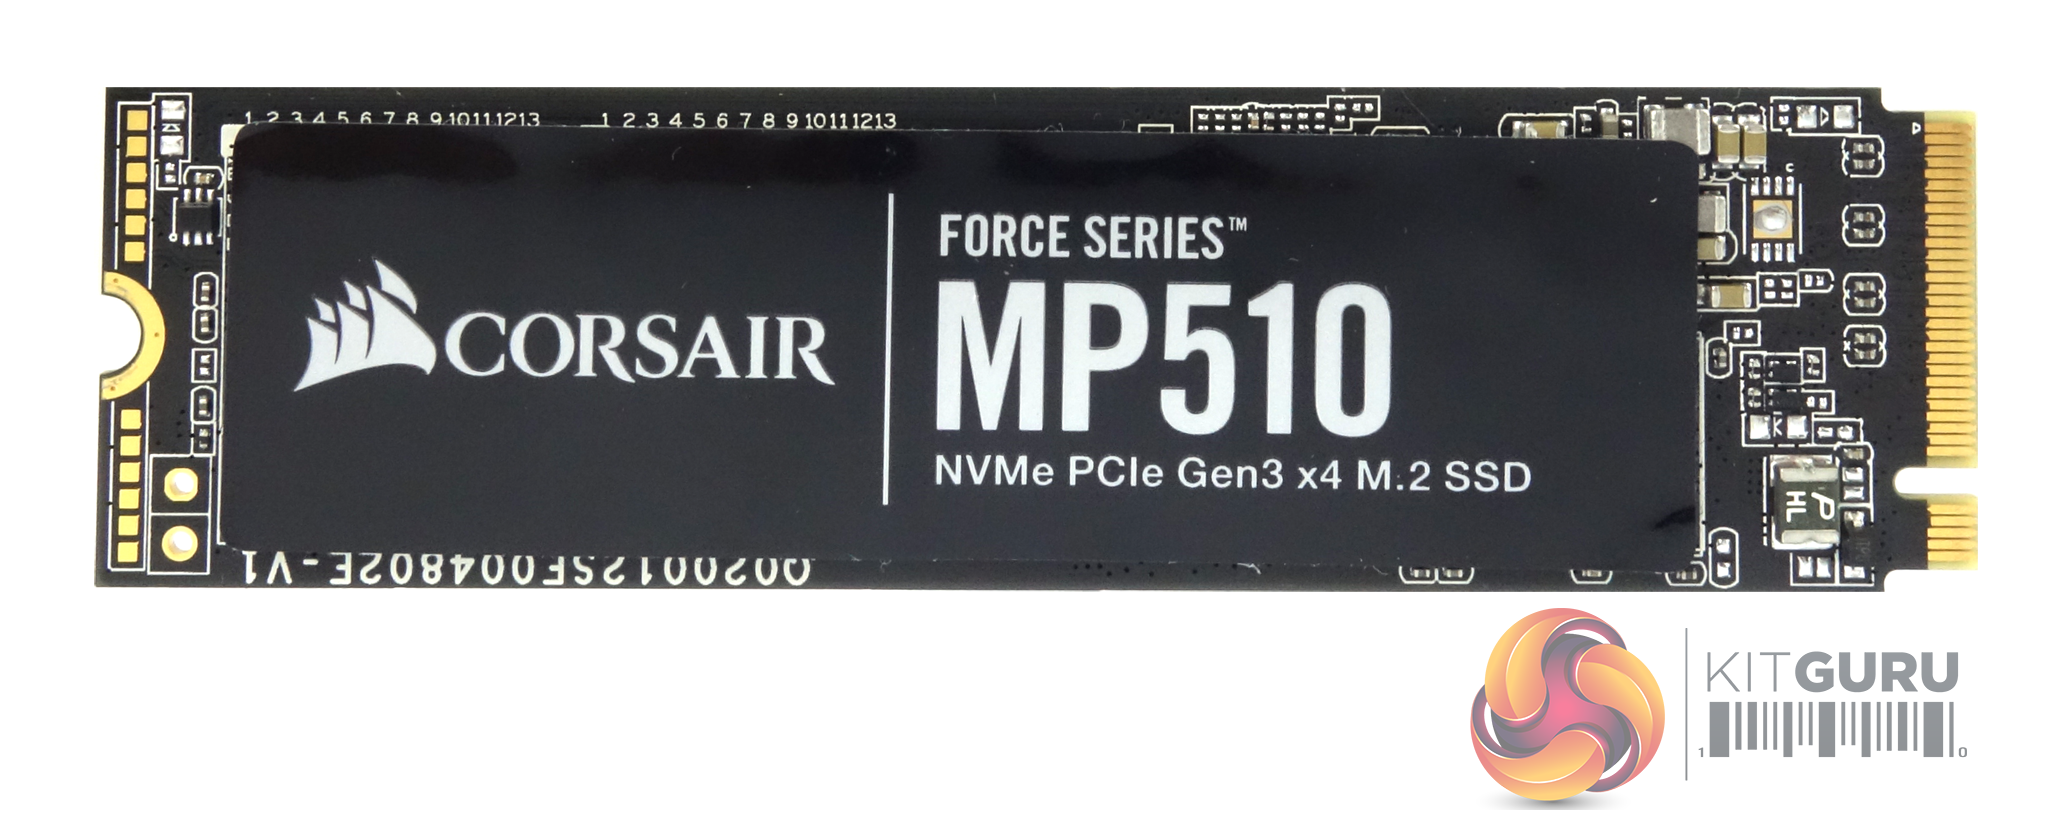
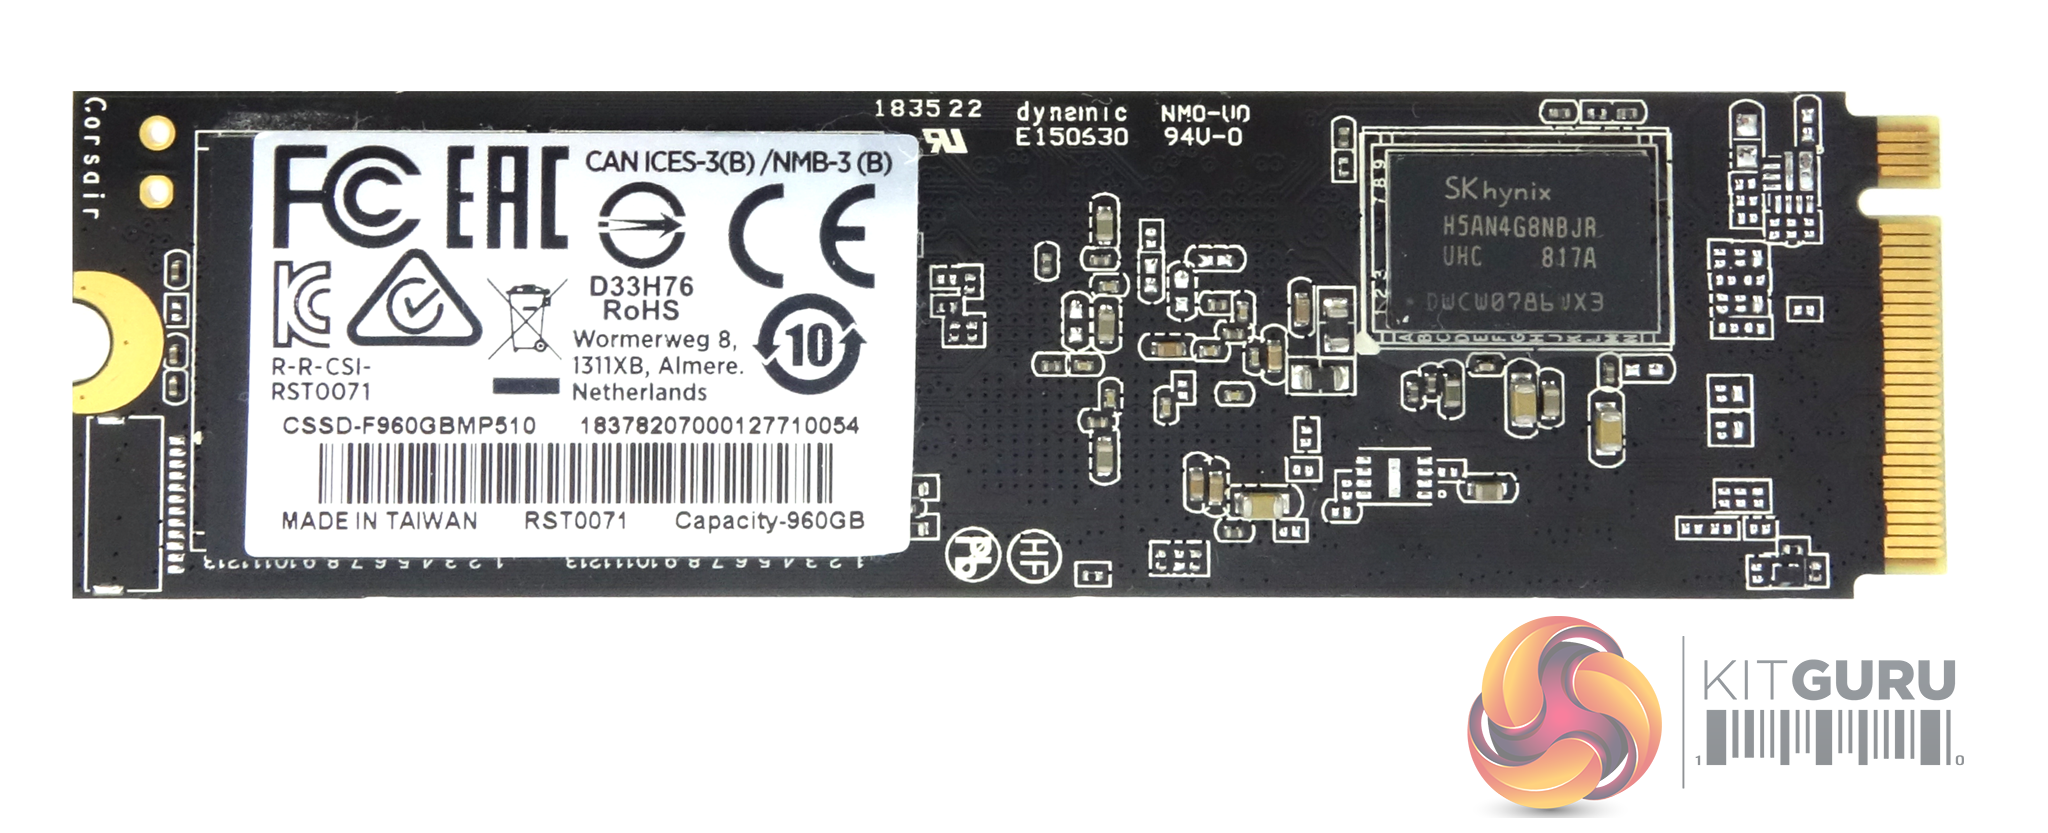
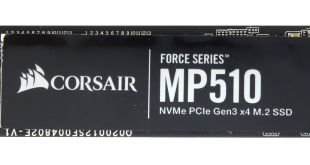
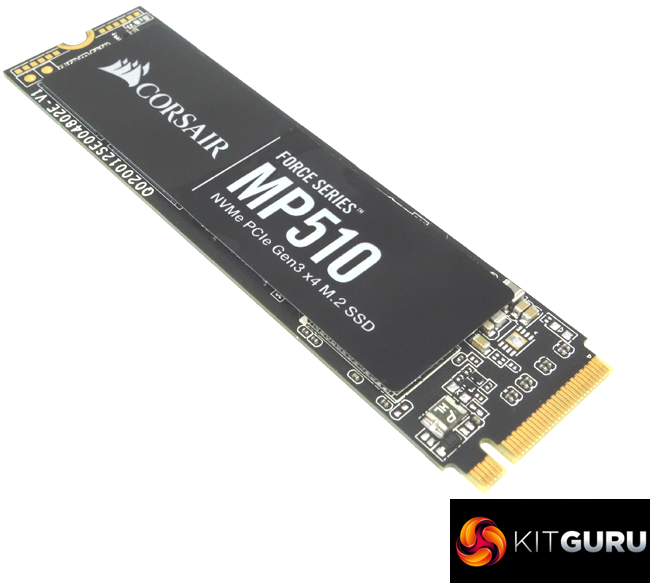
The 960GB drive is built on a double sided M.2 2280 format. Under the main label (which doesn't have the copper layer built into it like the MP500) sit two Toshiba 64-layer 256Gb BiCS3 3D TLC NAND packages, the Phison PS5012-E12 controller and one of the two SK hynix DDR4-2400 ICs looking after the drives cache duties. The other side of the PCB has another pair of NAND packages and the other SK hynix DDR4 chip.
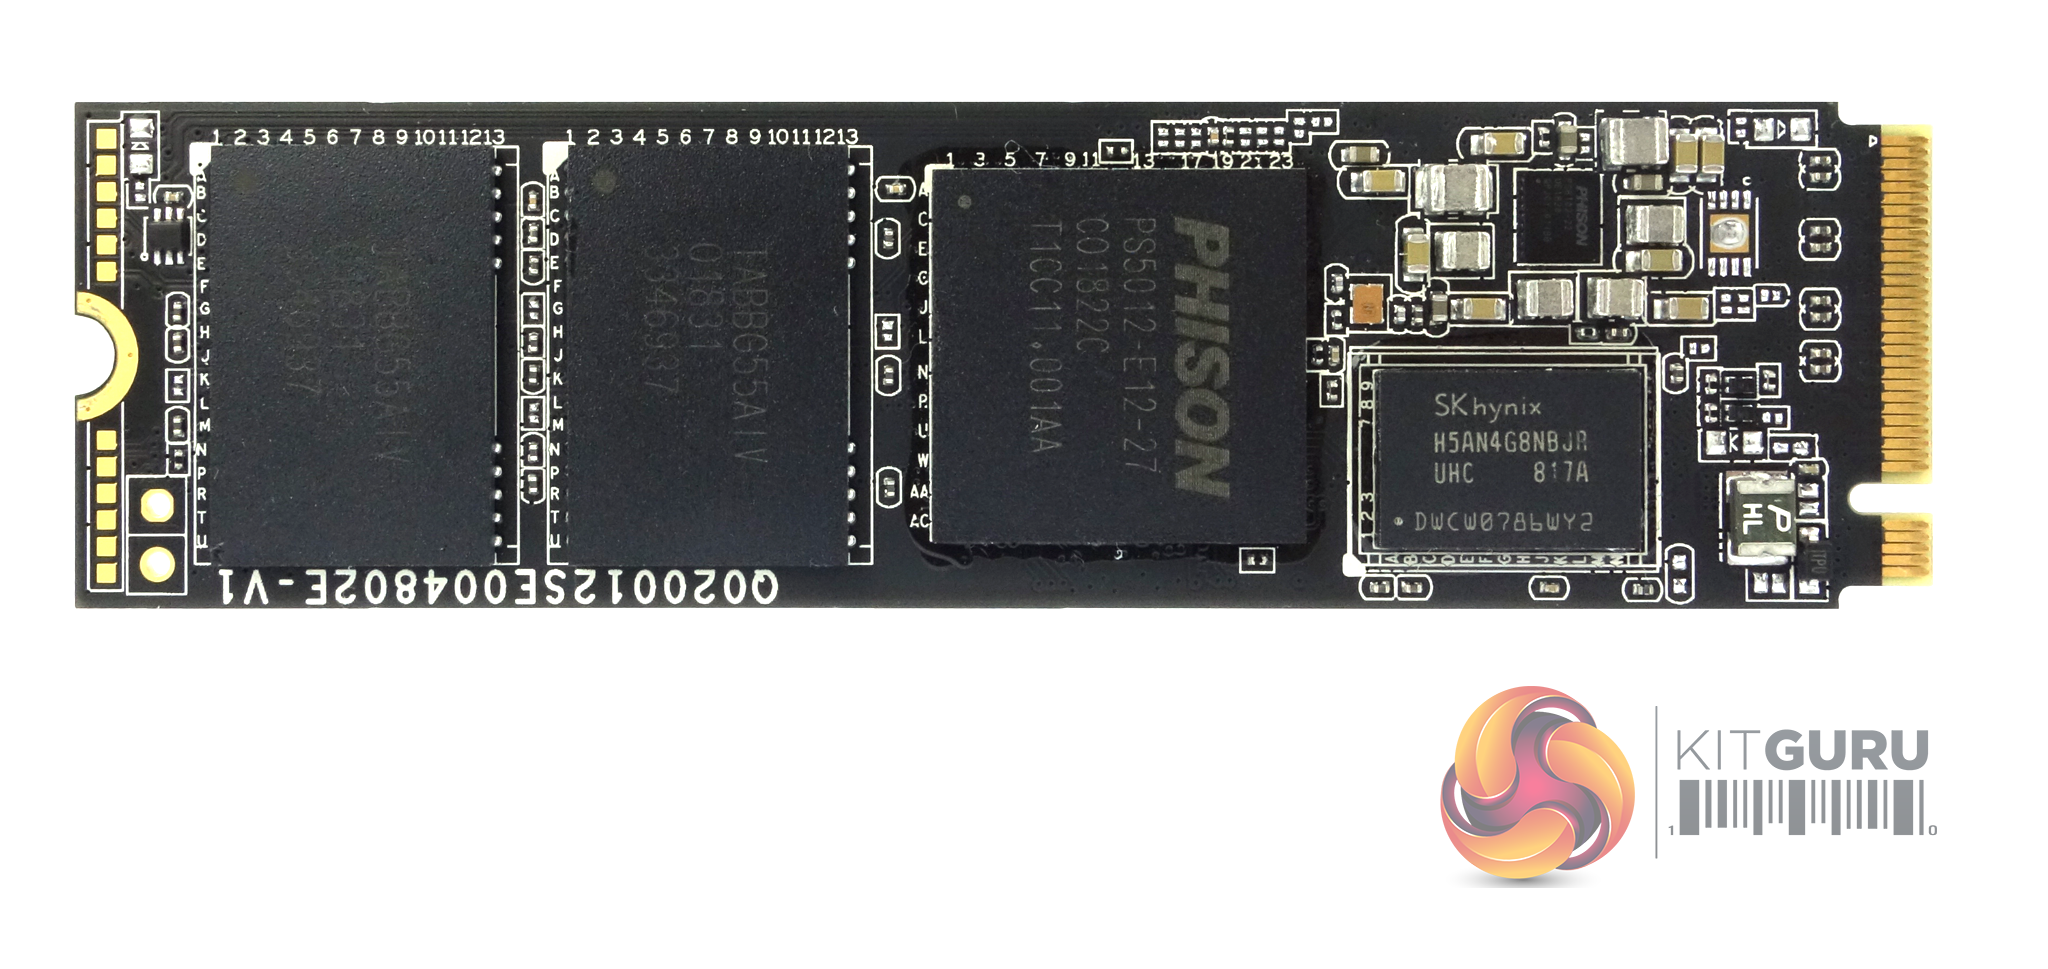
Phison's PS5012-E12 is their second generation PCIe Gen3 x4 NVMe controller. The 8-channel controller is built on a TSMC 28nm process and has been designed to work with TLC and QLC NAND technologies with support for Phison's SmartECC and the latest LDPC (Low-Density Parity Check) error correction as well as AES256, TCG OPAL and TCG Pyrite hardware encryption support. With 8 NAND channels and 32 NAND chip enable lines, the maximum amount of NAND the controller can support is 8TB.
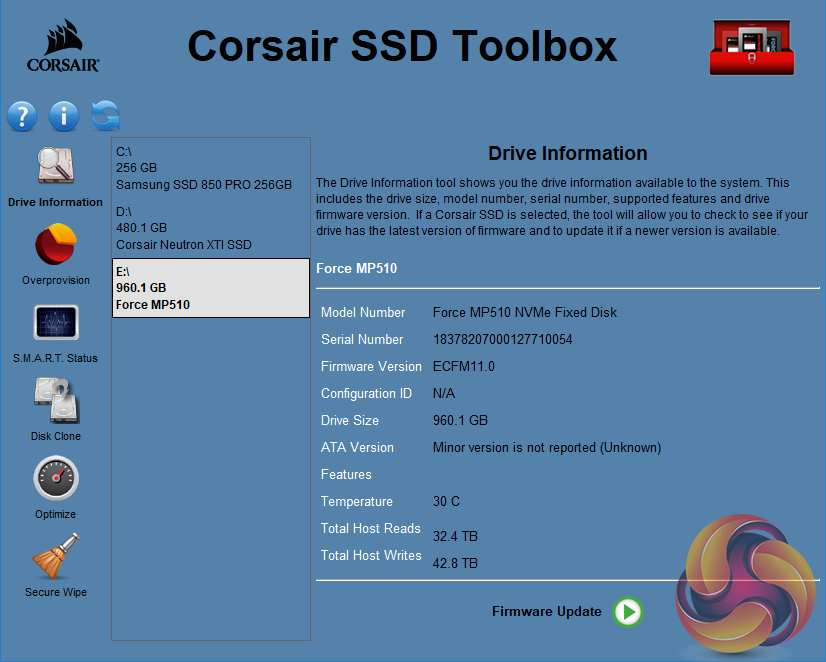
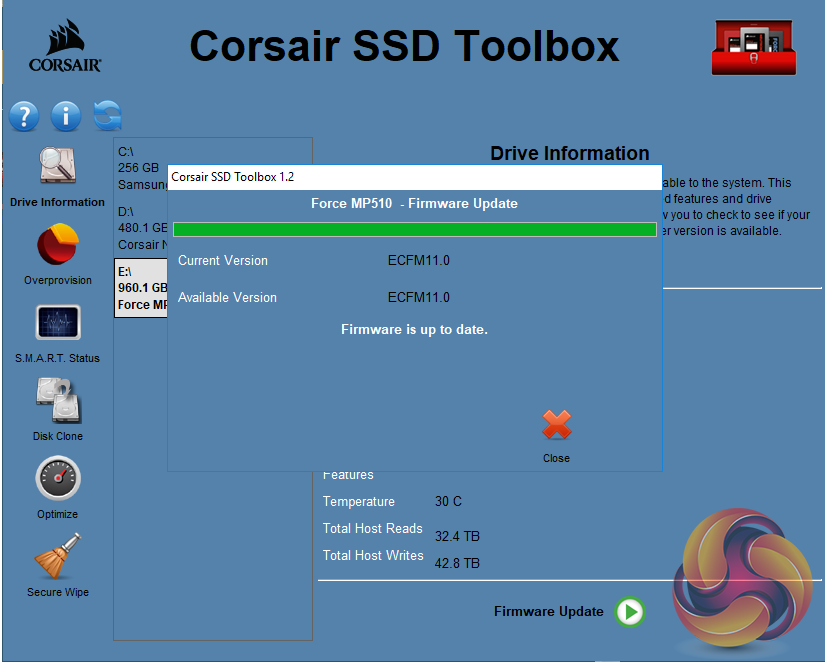

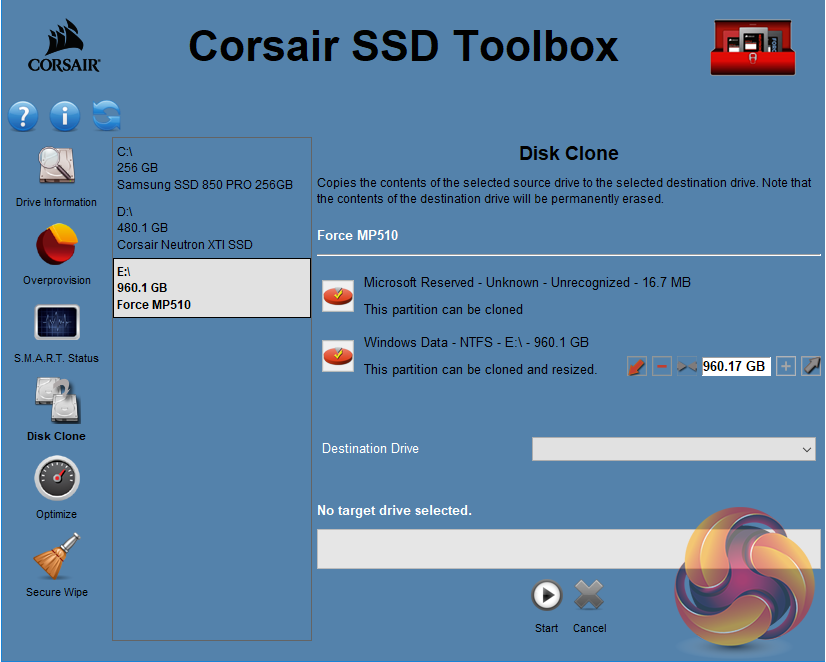
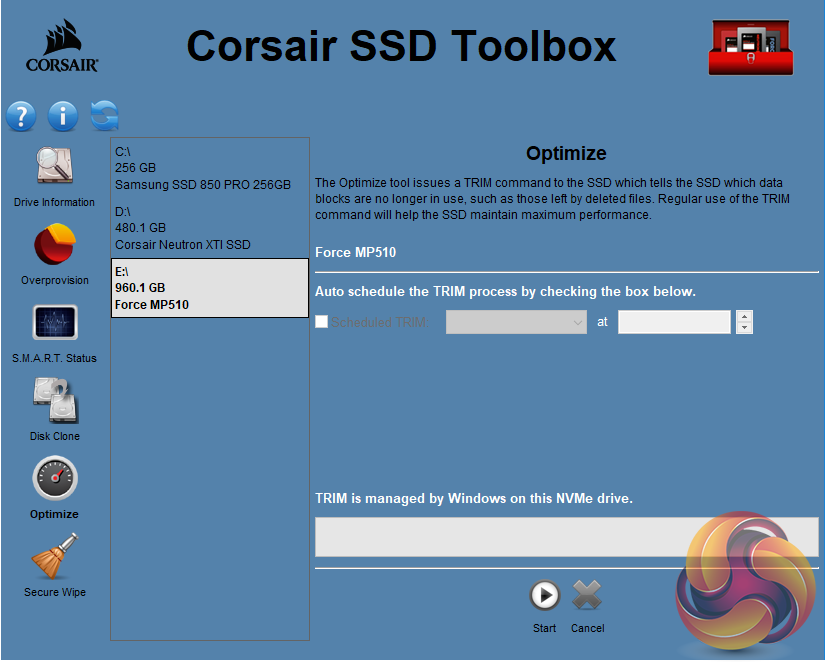
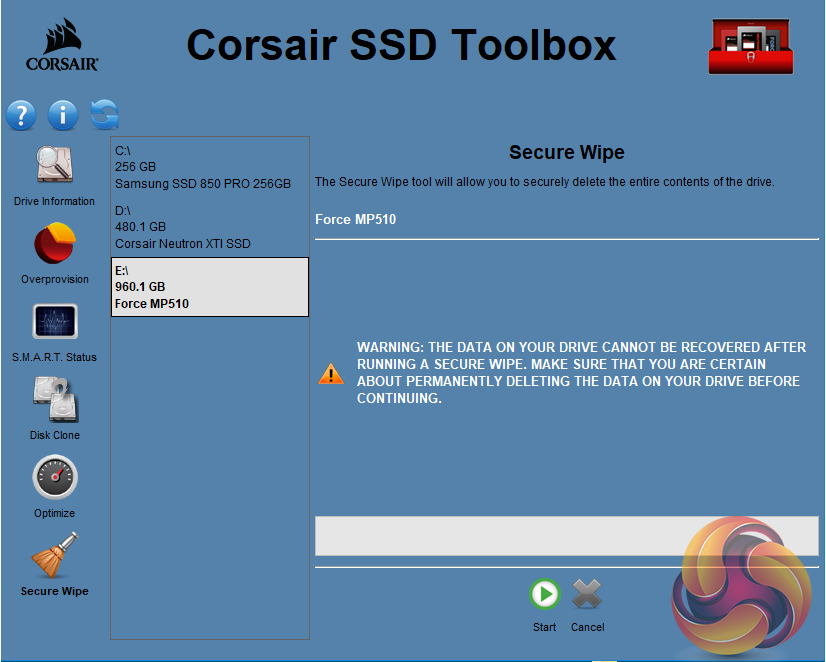
Corsair’s SSD management utility is called SSD Toolbox. It provides drive information and S.M.A.R.T details and also supports firmware updates, secure wiping of the drive, drive optimisation and incorporates a disk cloning utility.
For testing, the drives are all wiped and reset to factory settings by HDDerase V4. We try to use free or easily available programs and some real world testing so you can compare our findings against your own system. This is a good way to measure potential upgrade benefits.
Main system:
Intel Core i7-7700K with 16GB of DDR4-3200 RAM, Sapphire R9 390 Nitro and an Asus Prime Z270-A motherboard.
Other drives
Corsair Force MP500 480GB
Intel SSD760p 512GB
Kingston A1000 480GB
Plextor M9Pe(Y) 512GB
Plextor M8PeG 512GB
PNY CS2030 240GB
Samsung SSD970 EVO 2TB
Samsung SSD970 PRO 1TB
Samsung SSD960 PRO 2TB
Samsung SSD960 EVO 1TB
Toshiba OCZ RD400 512GB
Western Digital Black NVMe 1TB
Western Digital Black PCIe 512GB
Software:
Atto Disk Benchmark.
CrystalMark 3.0.3.
AS SSD.
IOMeter.
Futuremark PC Mark 8
All our results were achieved by running each test five times with every configuration this ensures that any glitches are removed from the results. Trim is confirmed as running by typing fsutil behavior query disabledeletenotify into the command line. A response of disabledeletenotify =0 confirms TRIM is active.
CrystalDiskMark is a useful benchmark to measure the theoretical performance levels of hard drives and SSDs.
Currently we are using v6.0 to test NVMe drives.
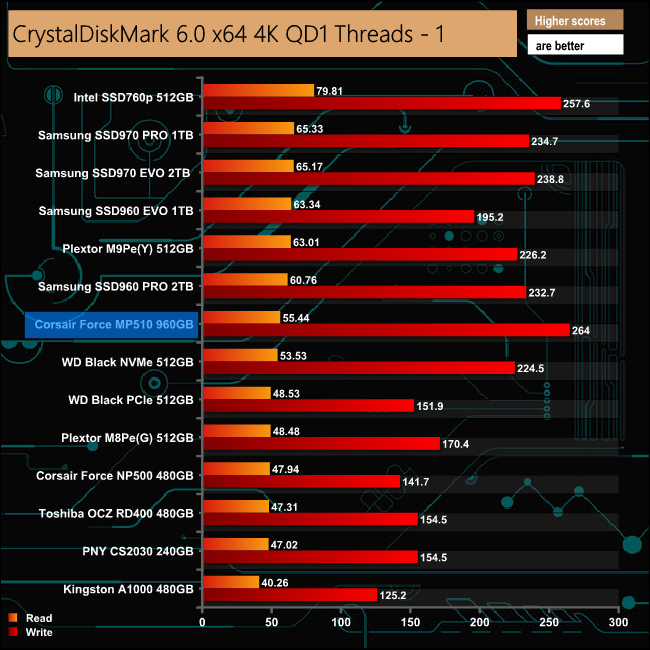

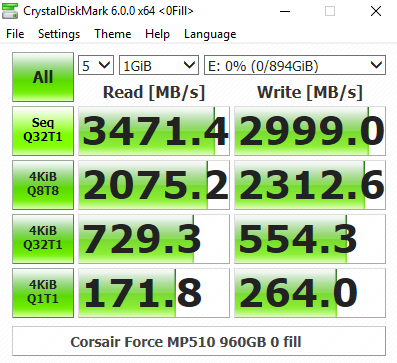
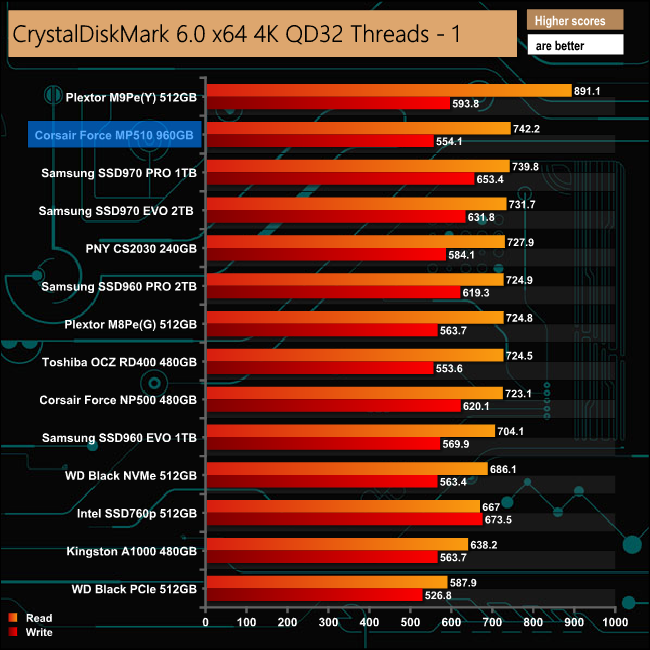
In the CrystalDiskMark benchmark, the MP510 sits firmly in the middle of the pack in the 4K test at a queue depth of 1, but even here the write performance is very impressive – in fact, its score of 264MB/s is the fastest write result we have seen to date for a consumer drive. However, deepening the queue depth sees the drive climb through the chart in to second place. There's a marked improvement in 4K read performance at lower queue depths when switching to the highly compressible data of CrystalDiskMark's 0 fill test.
The ATTO Disk Benchmark performance measurementtool is compatible with Microsoft Windows. Measure your storage systems performance with various transfer sizes and test lengths for reads and writes. Several options are available to customize your performance measurement including queue depth, overlapped I/O and even a comparison mode with the option to run continuously. Use ATTO Disk Benchmark to test any manufacturers RAID controllers, storage controllers, host adapters, hard drives and SSD drives and notice that ATTO products will consistently provide the highest level of performance to your storage.
We are using version 3.5 for our NVMe disk tests.
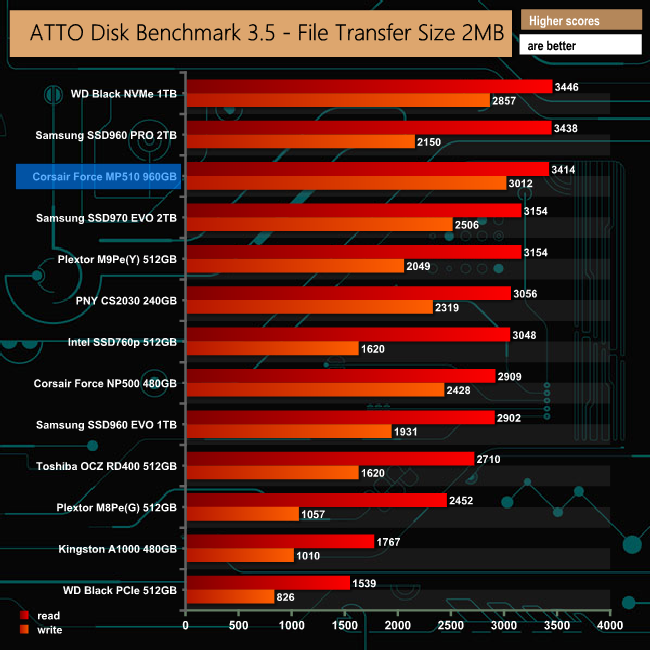
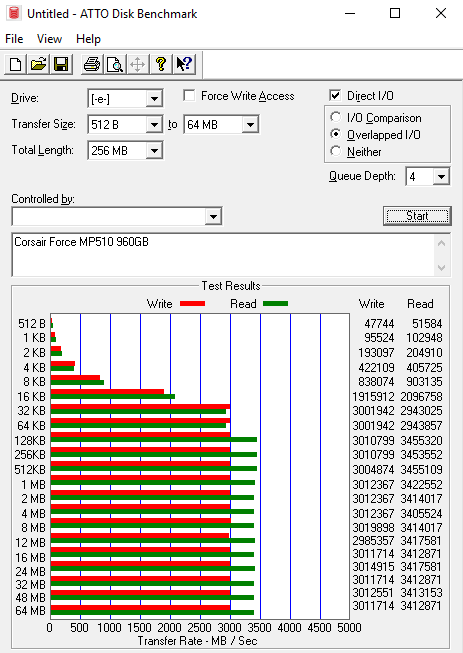
Corsair quotes Sequential read/write performance figures for the 960GB MP510 at up to 3,480MB/s and 3,000MB/s respectively. We could confirm these figures with the ATTO benchmark, the review drive producing a read score of 3,414MB/s with 3,012MB/s for writes.
AS SSD is a great free tool designed just for benching Solid State Drives. It performs an array of sequential read and write tests, as well as random read and write tests with sequential access times over a portion of the drive. AS SSD includes a sub suite of benchmarks with various file pattern algorithms but this is difficult in trying to judge accurate performance figures.
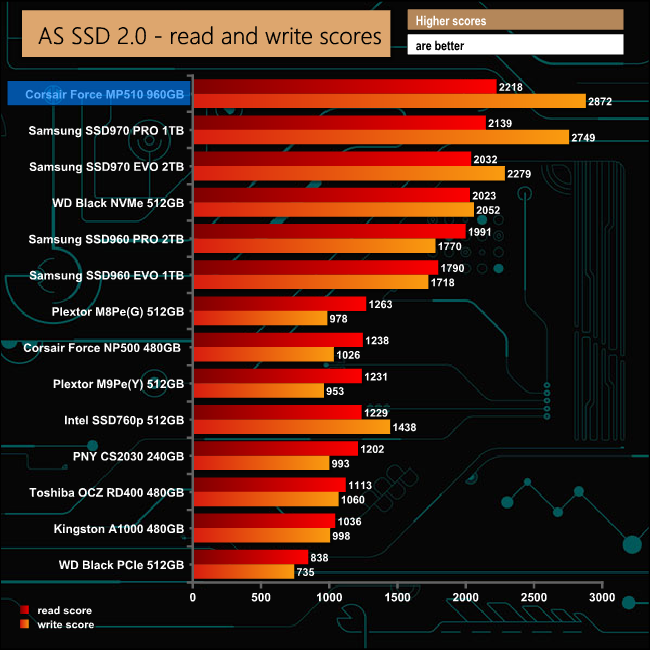
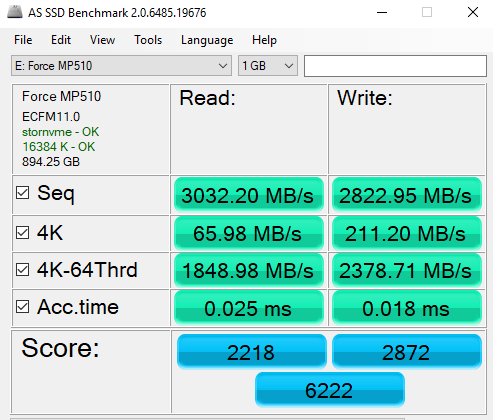
The MP510 goes straight to the top of our AS SSD scoring graph as the fastest consumer drive we've tested to date. The read score of 2218 is impressive enough but the write 2872 is superb, faster even than Samsung's mighty 970 Pro.
IOMeter is another open source synthetic benchmarking tool which is able to simulate the various loads placed on hard drive and solid state drive technology. There are many ways to measure the IOPS performance of a Solid State Drive, so our results will sometimes differ from manufacturer’s quoted ratings. We do test all drives in exactly the same way, so the results are directly comparable.
We test 128KB Sequential read and write and random read and write 4k tests. The test setup’s for the tests are listed below. Each is run five times.
128KB Sequential Read / Write.
Transfer Request Size: 128KB Span: 8GB Thread(s): 1, Outstanding I/O: 1-32 Test Run: 20 minutes per test
4K Sustained Random Read / Write.
Transfer Request Size: 4KB Span: 80GB Thread(s): 4, Outstanding I/O: 1-32 Test Run: 20 minutes per test
4K Random 70/30 mix Read/Write.
Transfer Request Size: 4KB Span: 80GB Reads: 70% Writes: 30% Thread(s): 4 Outstanding I/O: 2 – 32 Test Run: 20 minutes
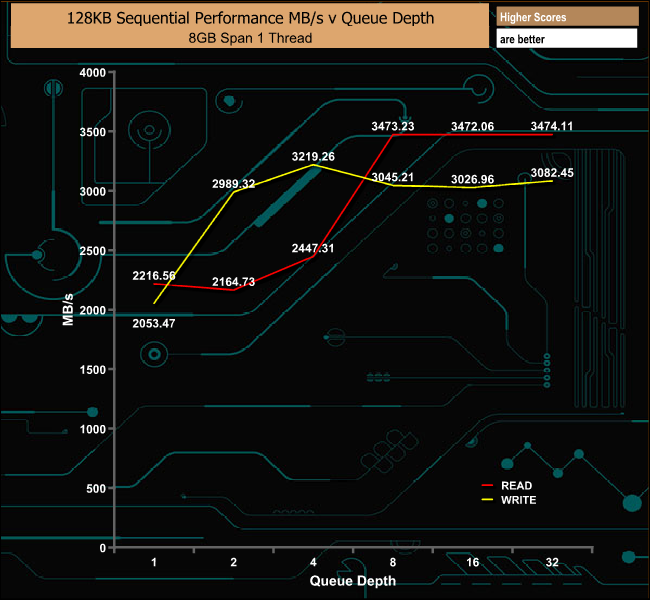
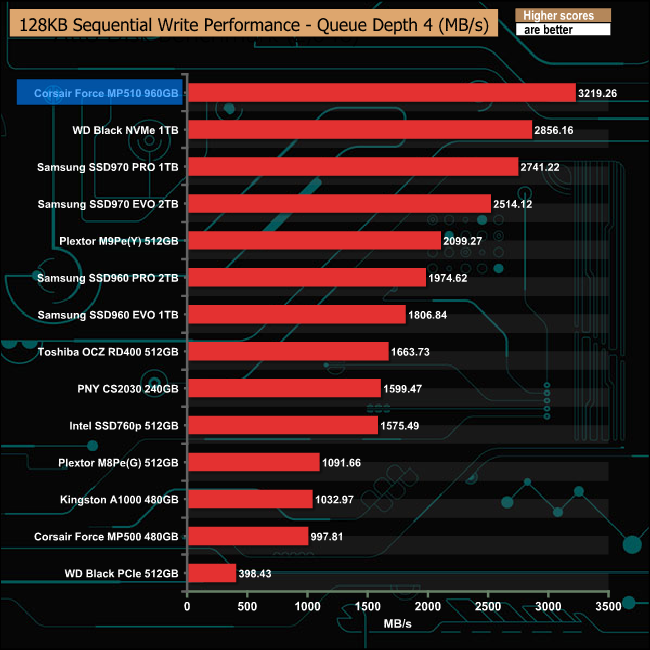
As with the ATTO benchmark figures, the 128KB Sequential tests also confirmed the official figures of 3,480MB/s reads and 3,000MB/s for writes. The review drive produced a read score of 3,474.11MB/s with writes coming in at 3,082.45MB/s.
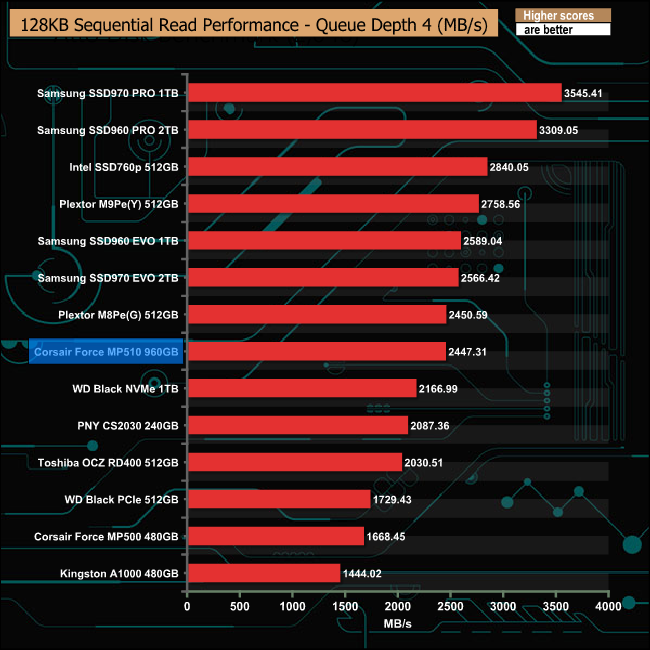
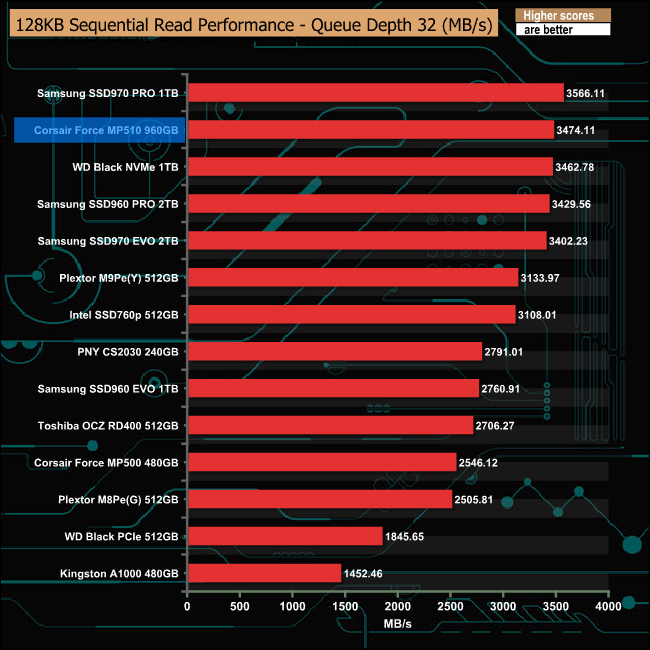
The drive's strongest Sequential read performance comes at a queue depth of 32.
128KB Sequential Write
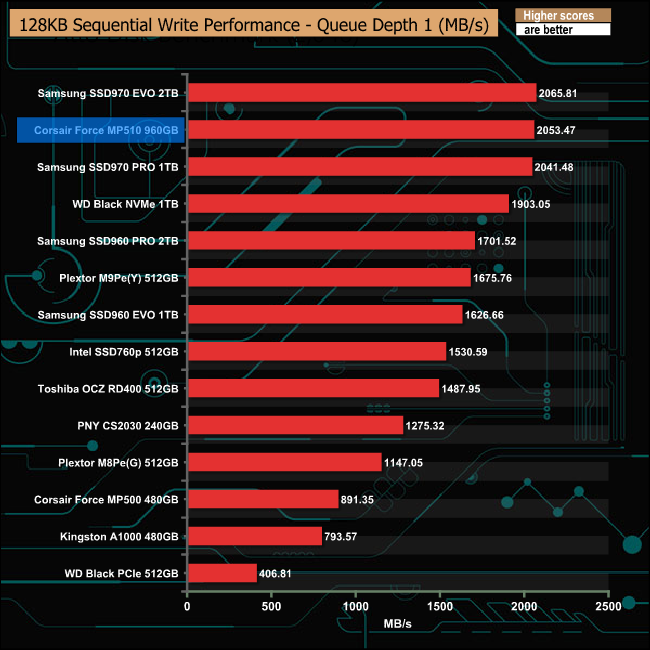
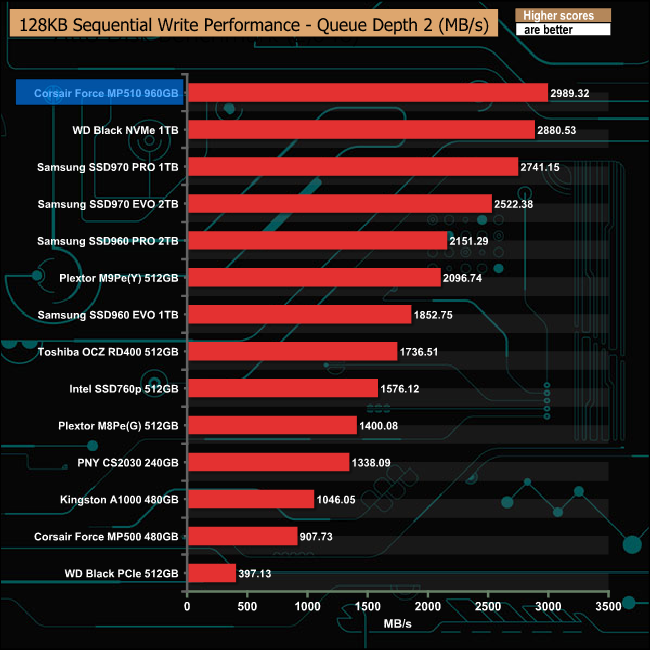
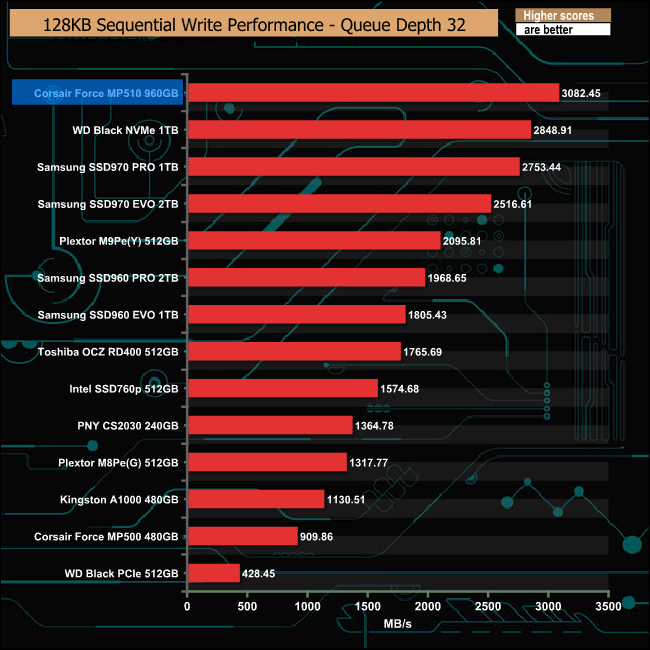
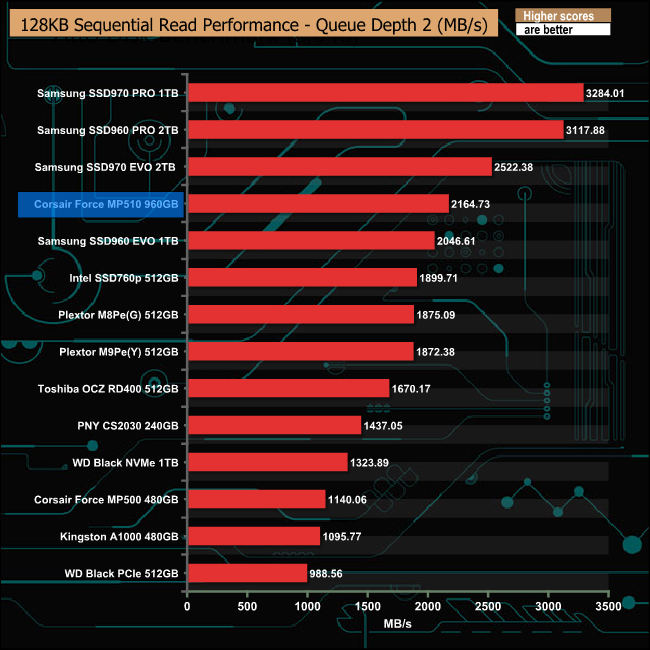
The drive's Sequential write performance is very consistent and, unlike the read performance, it hits the top spot in the performance graphs at queue depths 2, 4 and 32. The only QD it's not the fastest is at QD1 where it sits just shy of the Samsung SSD970 EVO.
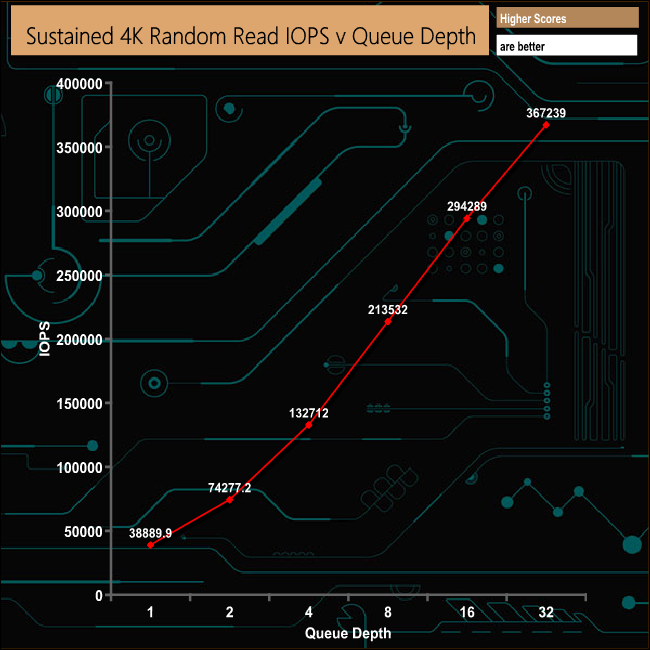
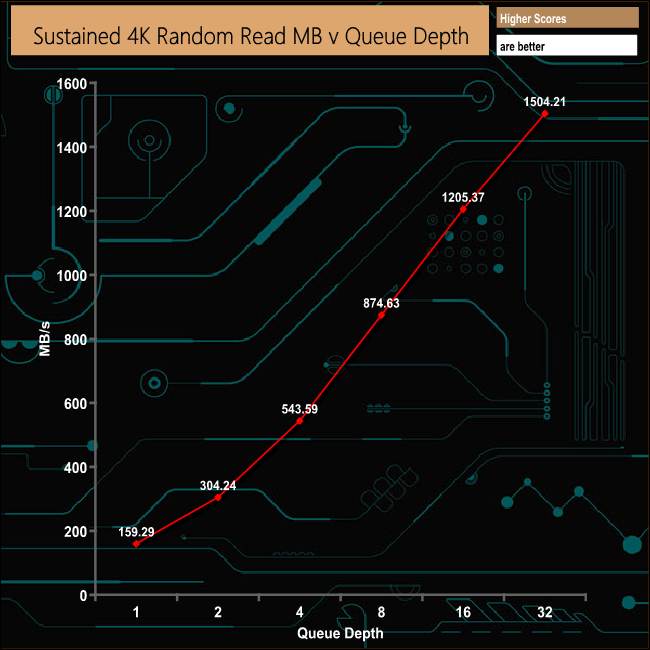
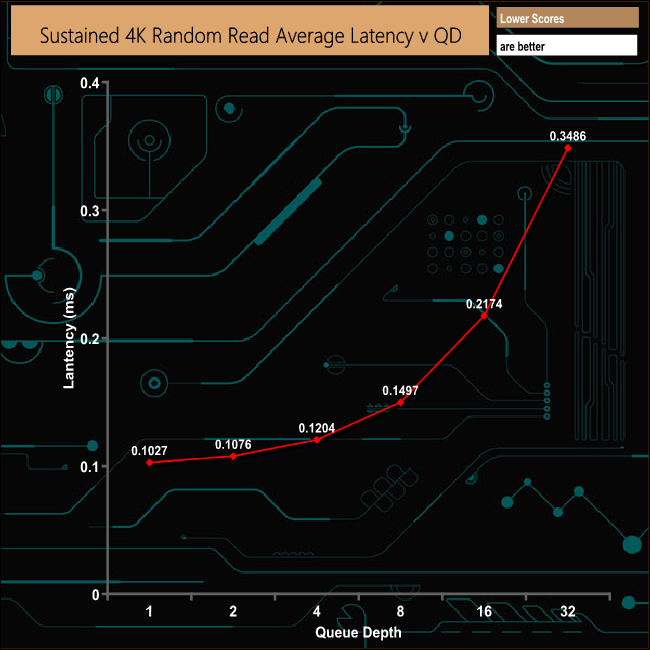
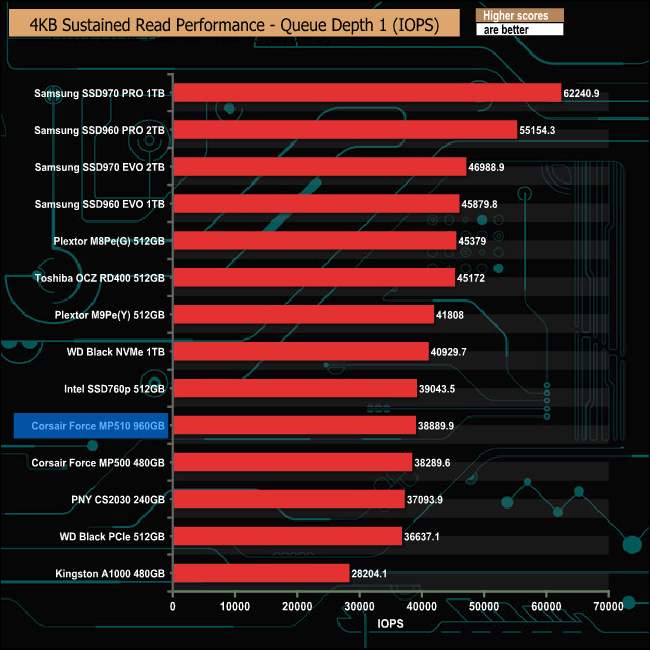
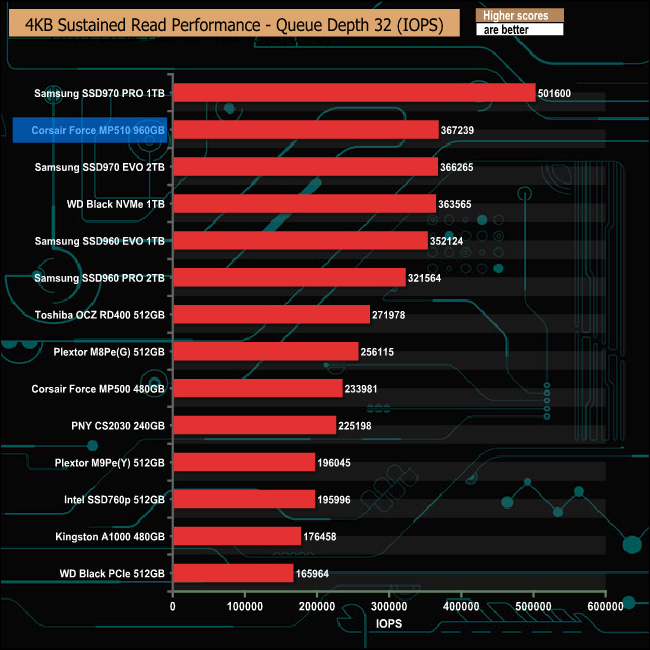
Corsair states that the MP510 is their fastest M.2 NVMe drive to date, something which we could confirm with our 4K Random read tests.
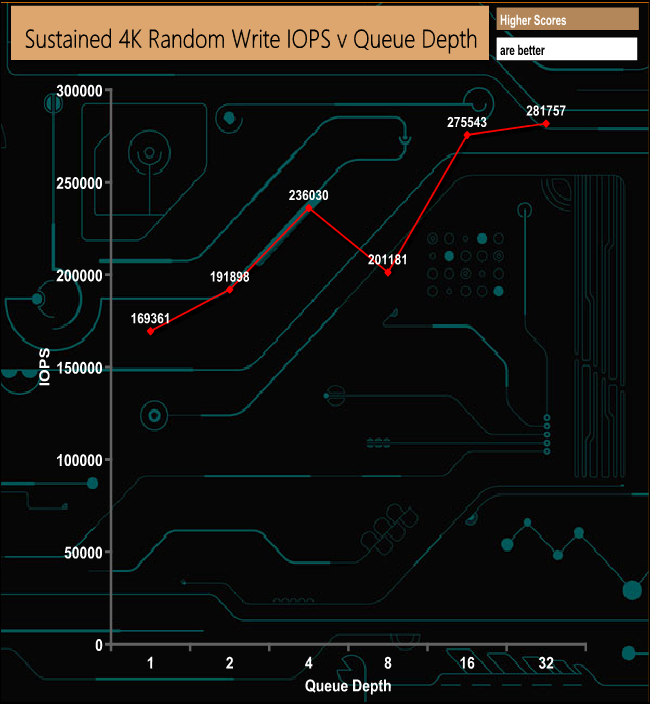
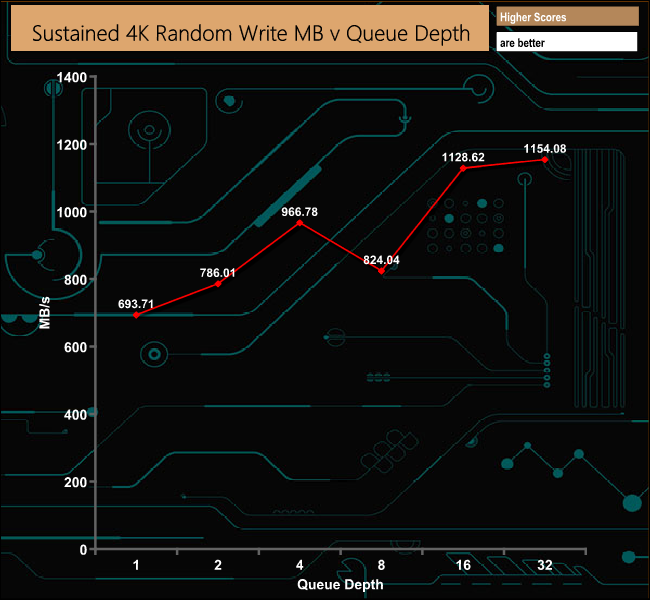
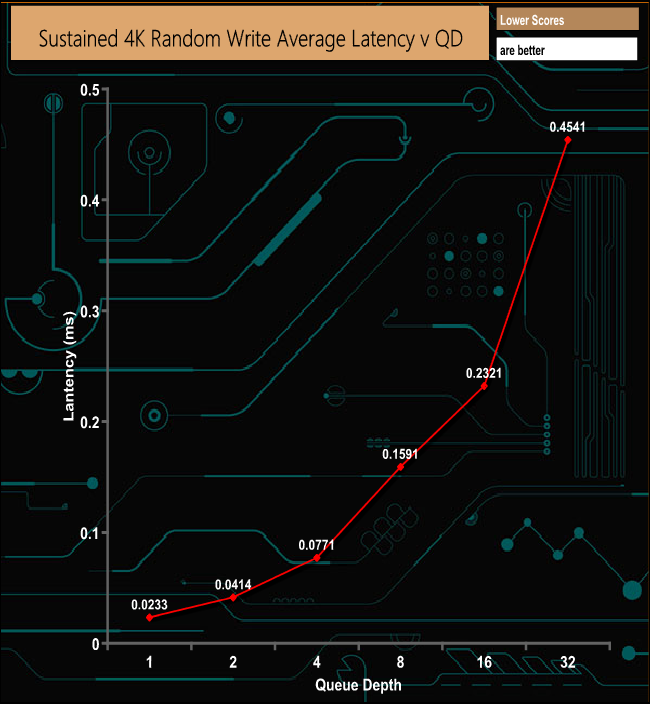
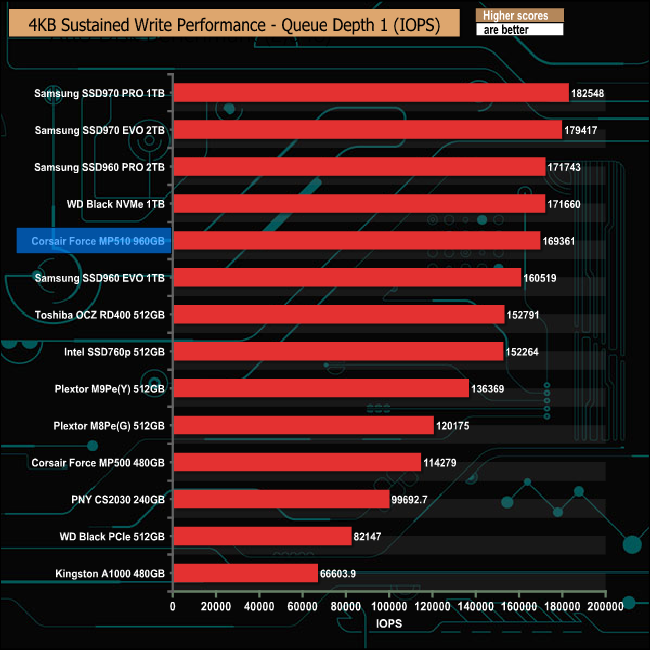
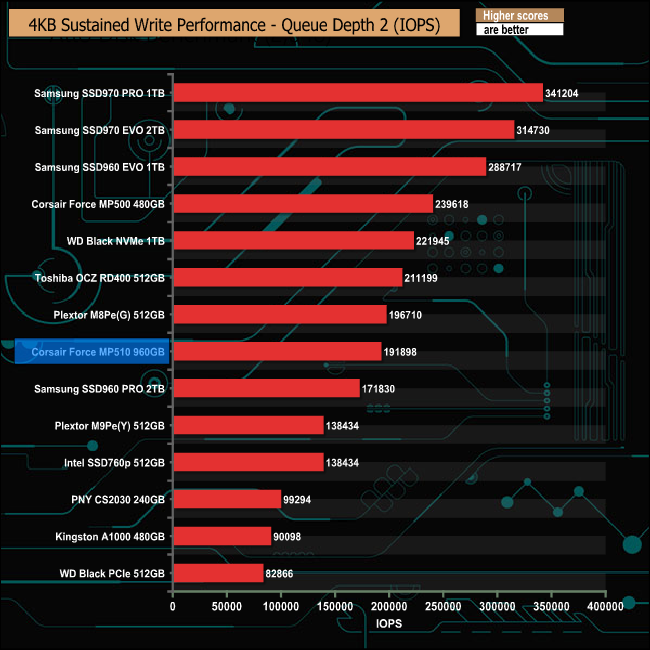
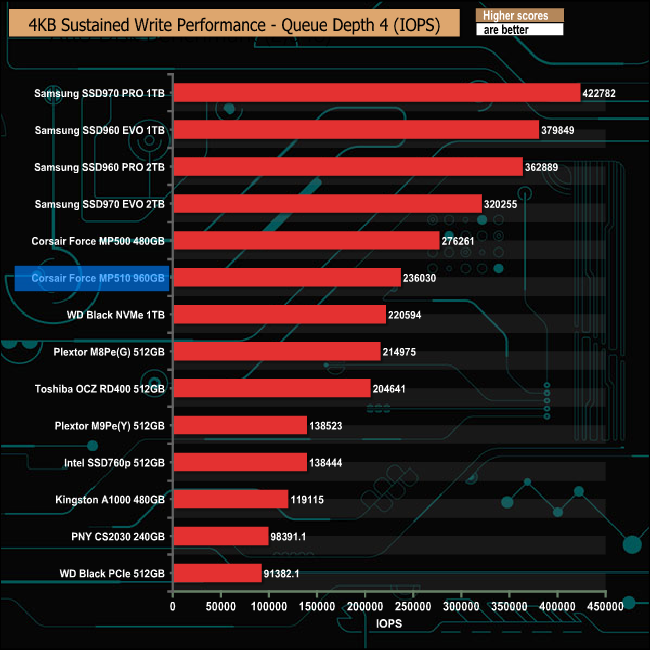
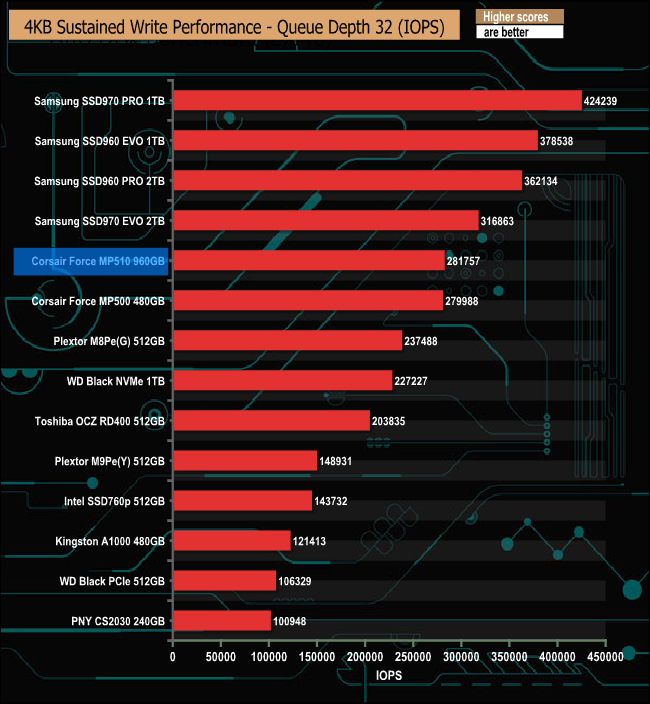
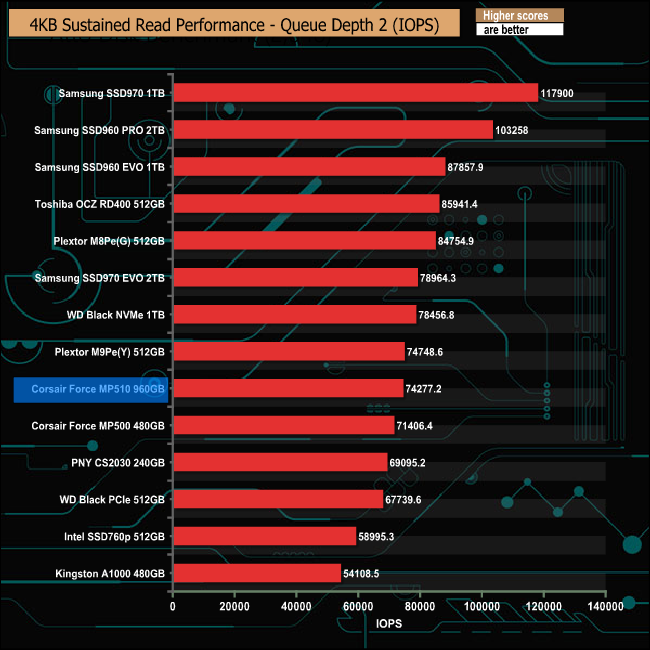
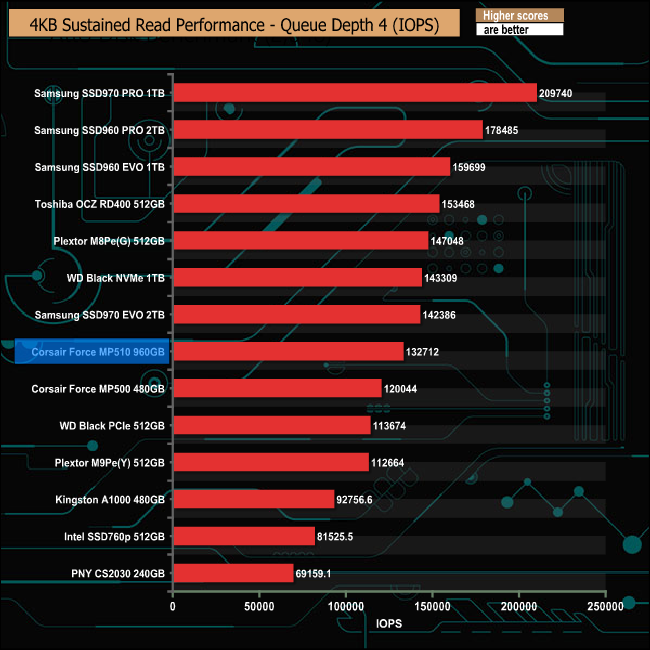
At a queue depth of 1 and again at QD32 in our 4K random write tests, the MP510 outperforms its predecessor the MP500, especially at QD1. However, in between those two marks at QDs 2 and 4 the roles are reversed as it's the MP500 that has the edge.
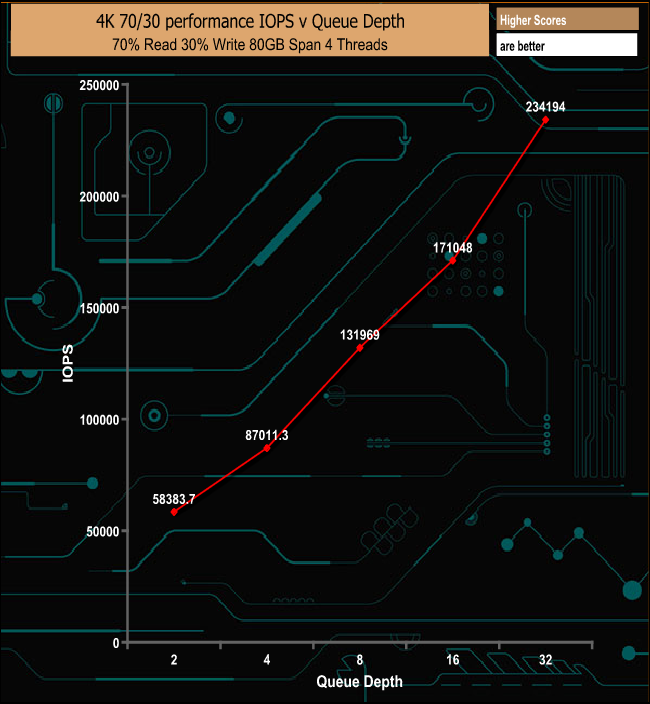
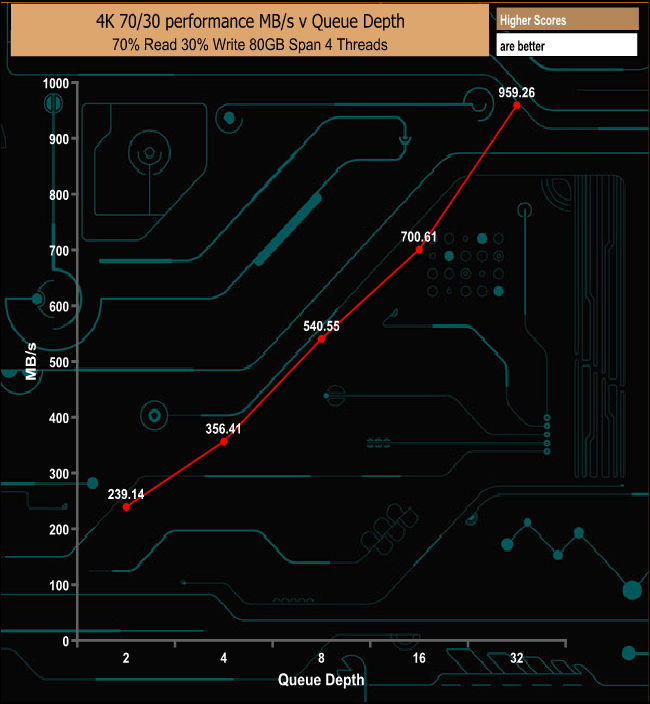
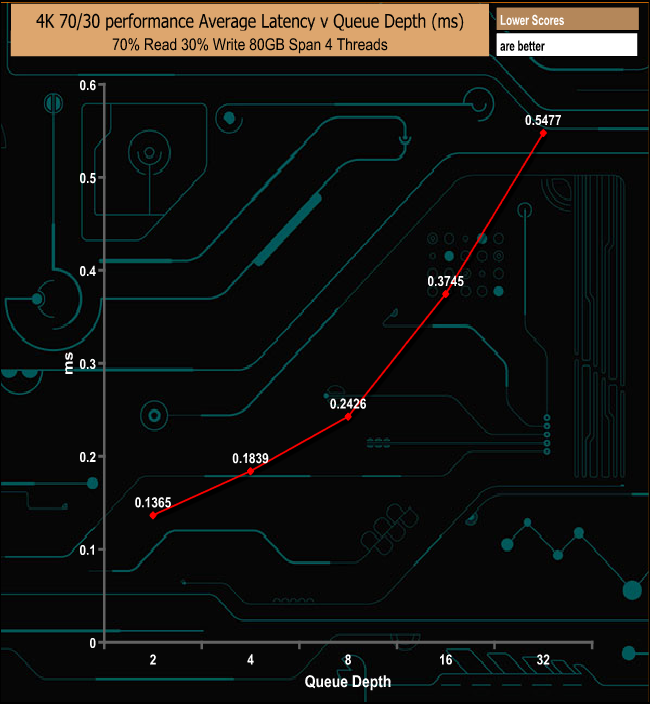
The MP510 handles the 4K 70/30 mixed read & write test pretty well, peaking at 234,194 IOPS (959.26 MB/s).
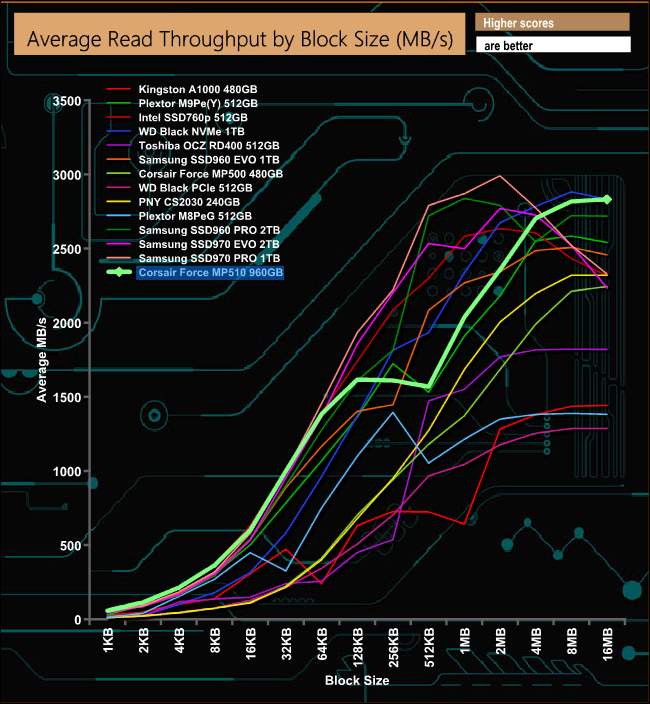
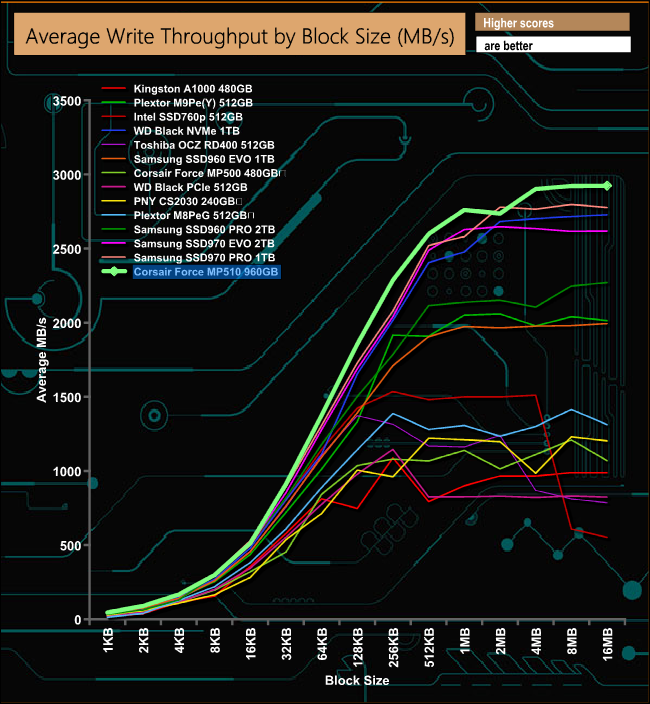
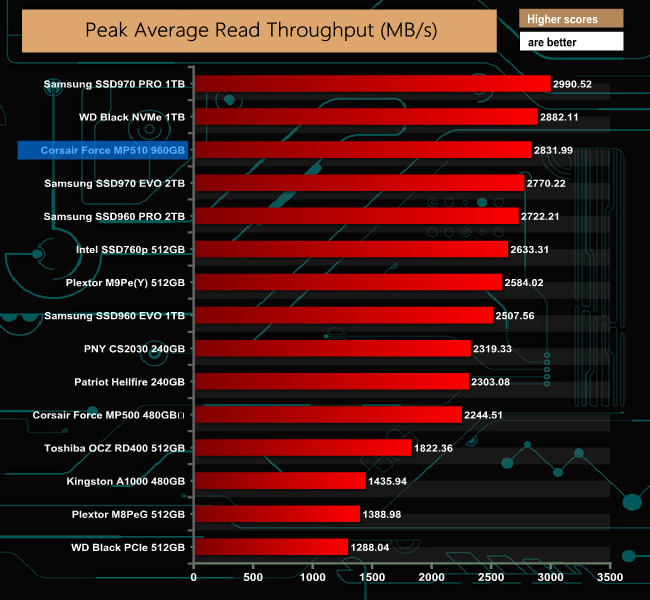
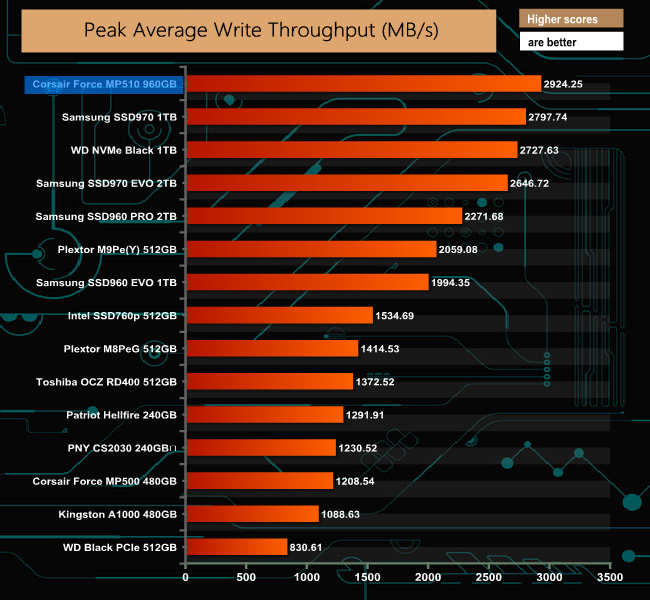
In our read throughput test, the drive's performance at the 512KB block mark faltered but it soon recovered to finish the test at a peak of 2,244.51MB/s. The smoothness of the write performance test is only interrupted by the slight loss in performance at the 2MB block mark where the drive drops from 2,735MB/s to 2,735MB/s, but as with the read throughput test the drive recovers quickly to peak at the end of the test at 2,924.25MB/s.
Futuremark’s PCMark 8 is a very good all round system benchmark but it’s Storage Consistency Test takes it to whole new level when testing SSD drives. It runs through four phases; Preconditioning, Degradation, Steady State, Recovery and finally Clean Up. During the Degradation, Steady State and Recovery phases it runs performance tests using the 10 software programs that form the backbone of PCMark 8; Adobe After Effects, Illustrator, InDesign, Photoshop Heavy and Photoshop Light, Microsoft Excel, PowerPoint, Word, Battlefield 3 and World of Warcraft. With some 18 phases of testing, this test can take many hours to run.
Preconditioning
The drive is written sequentially through up to the reported capacity with random data, write size of 256 × 512 = 131,072 bytes. This is done twice.
Degradation
Run writes of random size between 8 × 512 and 2048 × 512 bytes on random offsets for 10 minutes. It then runs a performance test. These two actions are then repeated 8 times and on each pass the duration of random writes is increased by 5 minutes.
Steady State
Run writes of random size between 8 × 512 and 2048 × 512 bytes on random offsets for final duration achieved in degradation phase. A performance test is then run. These actions are then re-run five times.
Recovery
The drive is idled for 5 minutes. Then a performance test is run. These actions are then repeated five times.
Clean Up
The drive is written through sequentially up to the reported capacity with zero data, write size of 256 × 512 = 131,072 bytes.

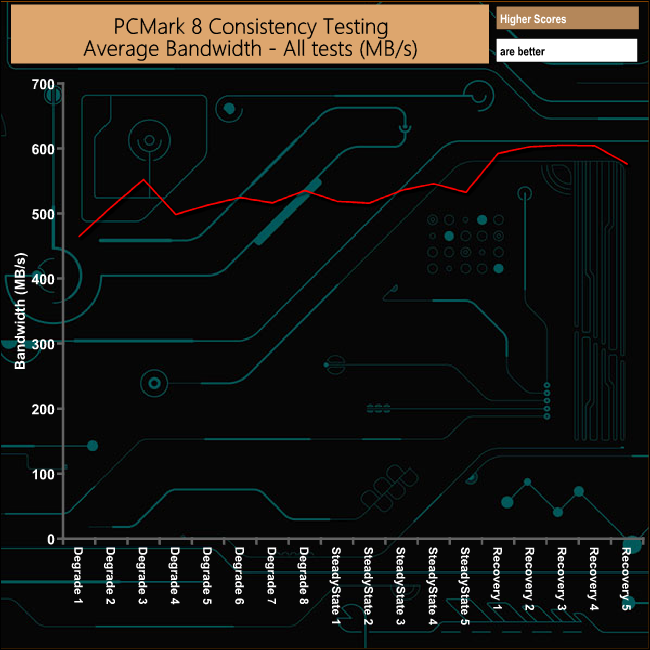
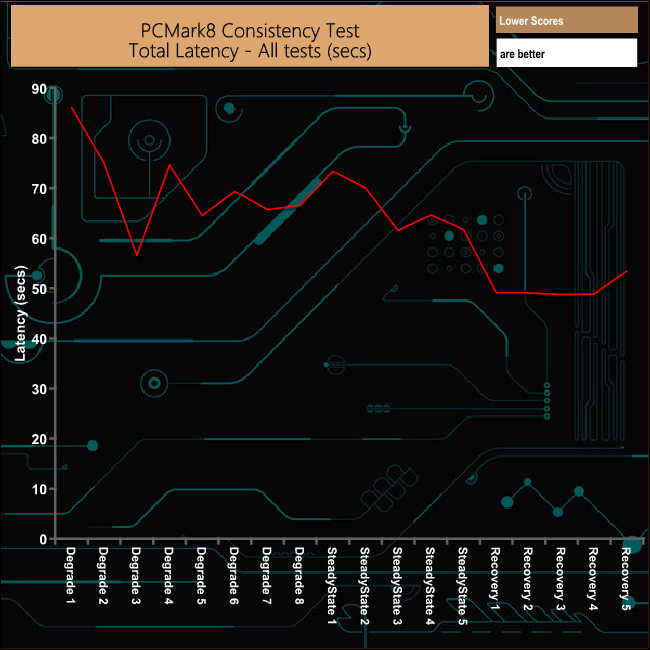
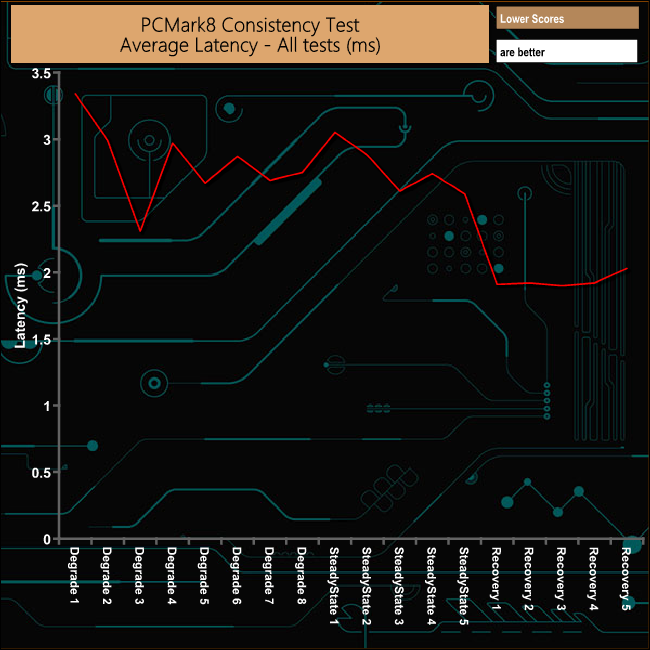
Overall the MP510 handles PCMark 8's Consistency test pretty well. Although the performance drops after the third Degradation run, it's a gradual drop and not a dive off a cliff. The drive's recovery is very consistent although there is a drop in performance during the last recovery phase.
PCMark 8’s Consistency Test provides a huge amount of performance data, so here we’ve looked a little closer at how the 960GB Force MP510 performs in each of the benchmarks test suites.
Adobe Creative Cloud
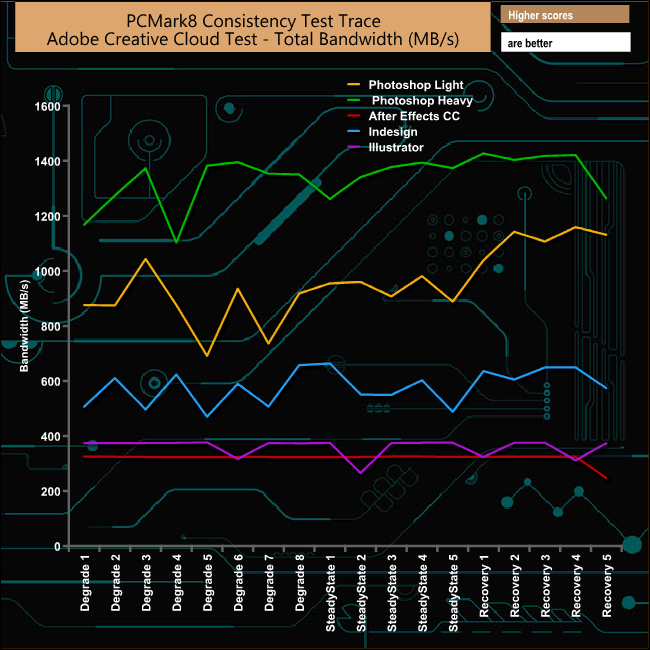
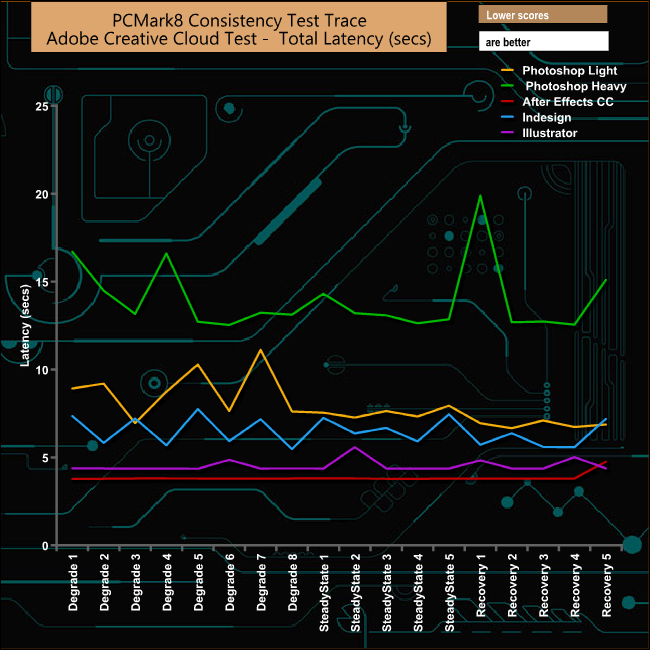
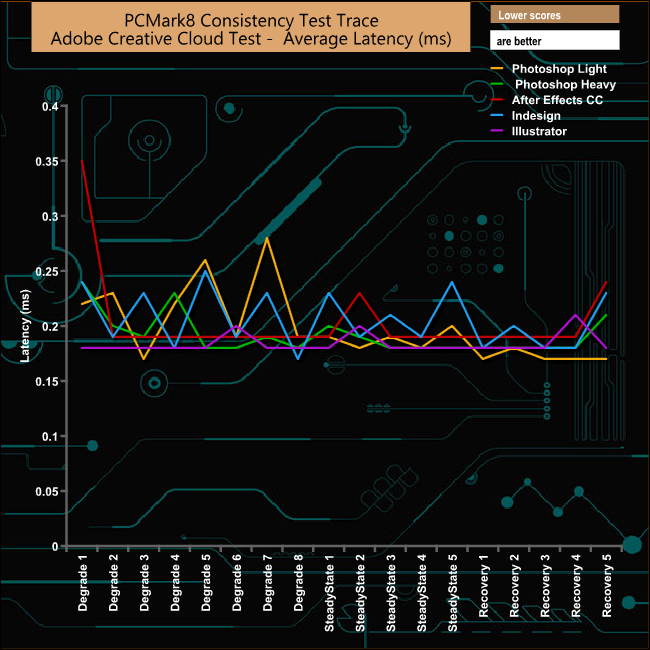
In the Adobe CC part of the test it's usually the Photoshop heavy test trace that causes a drive problems, but here the MP510 handled that test well and it was the Photoshop Light test that caused the drive to suffer.
Microsoft Office
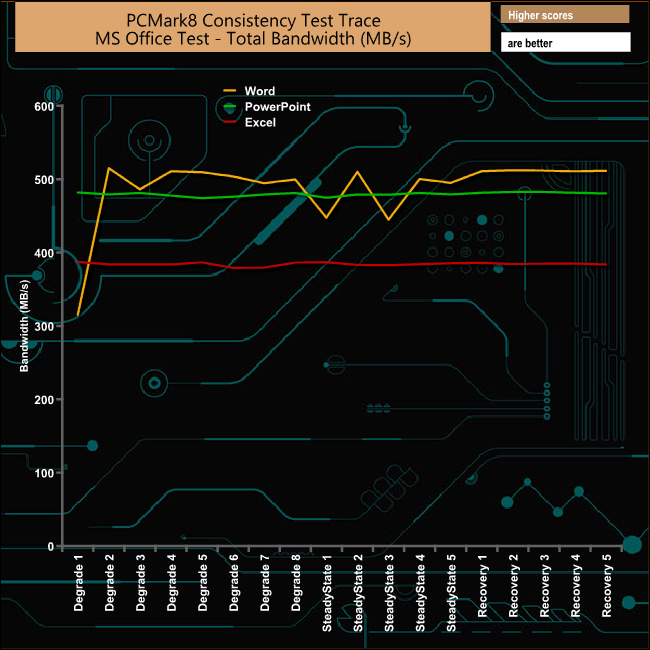
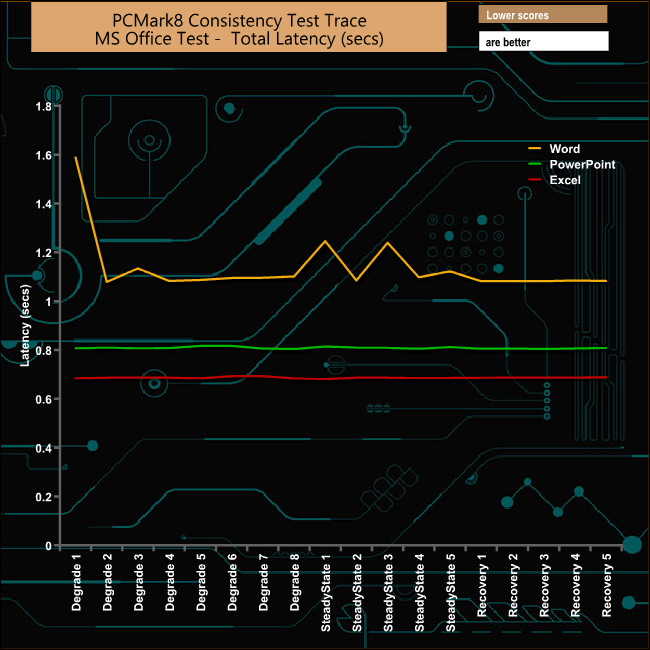
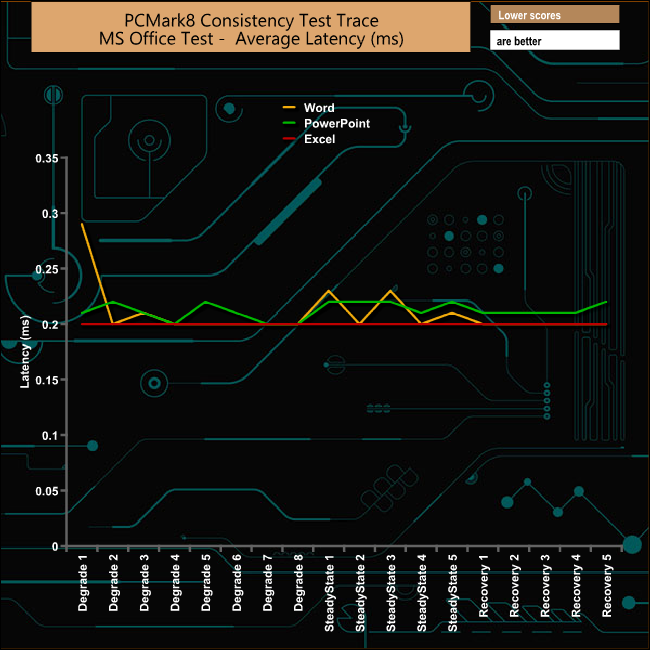
As is usual in the Microsoft Office section of the benchmark it's the Word test trace that causes problems. Having said that the MP510 deals with it more efficiently than many drives we've seen recently.
Casual Gaming
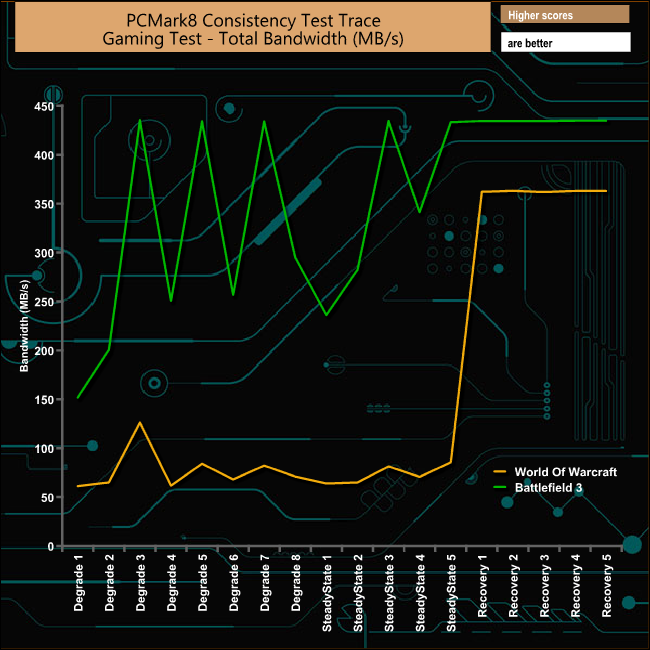
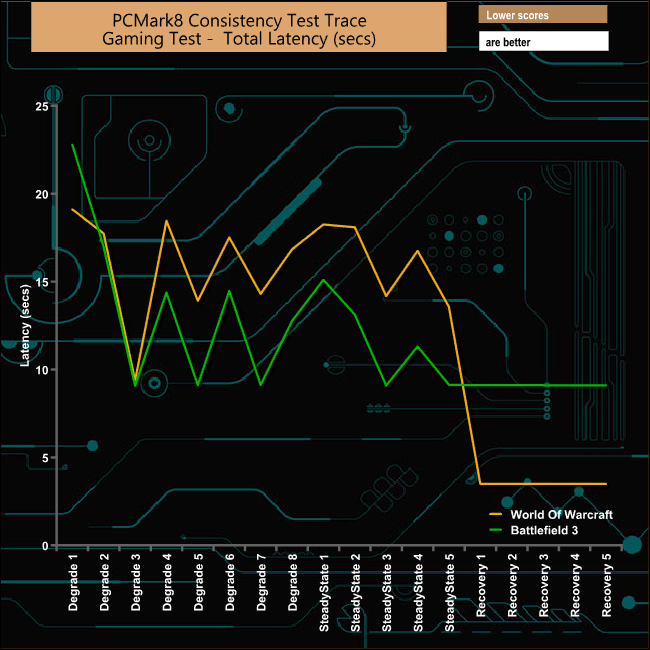
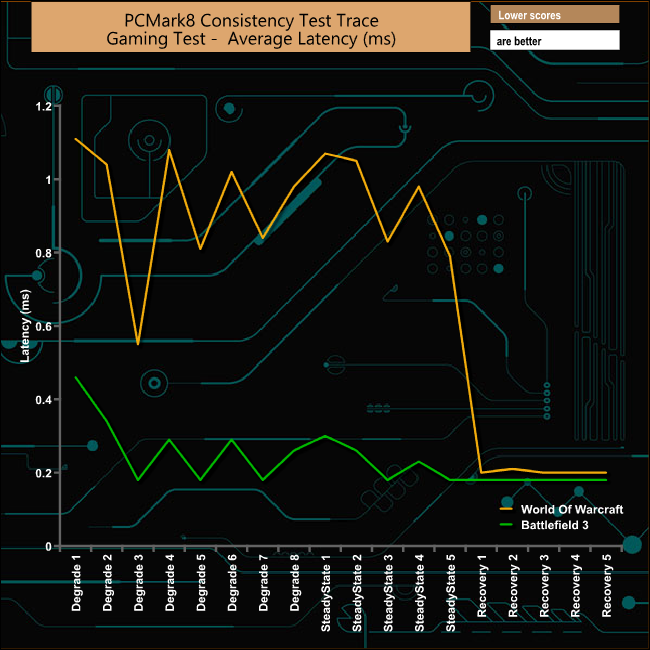
The drive doesn't handle the majority of the Casual Gaming test very well, with some significant drops in performance throughout the test run until it reaches the recovery phases. The performance of the drive through the recovery phases, during the World of Warcraft run, is very good indeed.
Just like the Consistency test, PCMark 8’s Standard Storage test also saves a large amount of performance data. The default test runs through the test suite of 10 applications three times. Here we show the total bandwidth performance for each of the individual test suites for the third and final benchmark run.
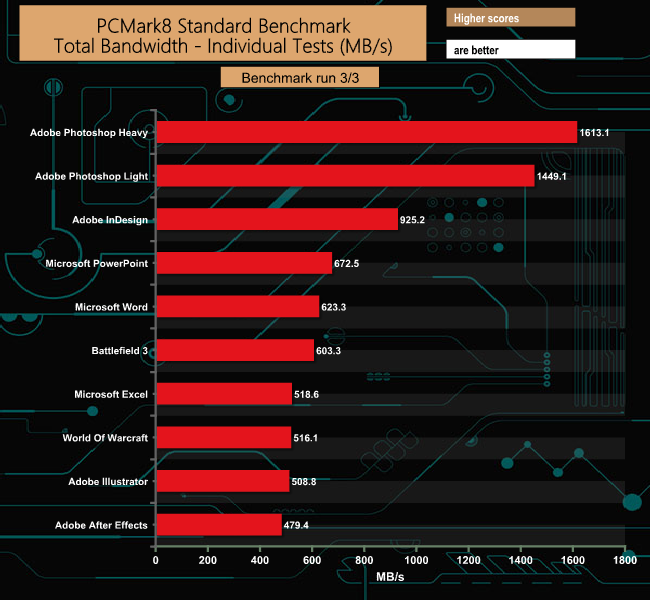
Some very good bandwidth figures from the MP510 in this test run particularly during the Adobe Photoshop Heavy and Light tests and the InDesign benchmark. Even the bandwidth score from the test at the bottom of the graph, Adobe's After Effects is really strong.
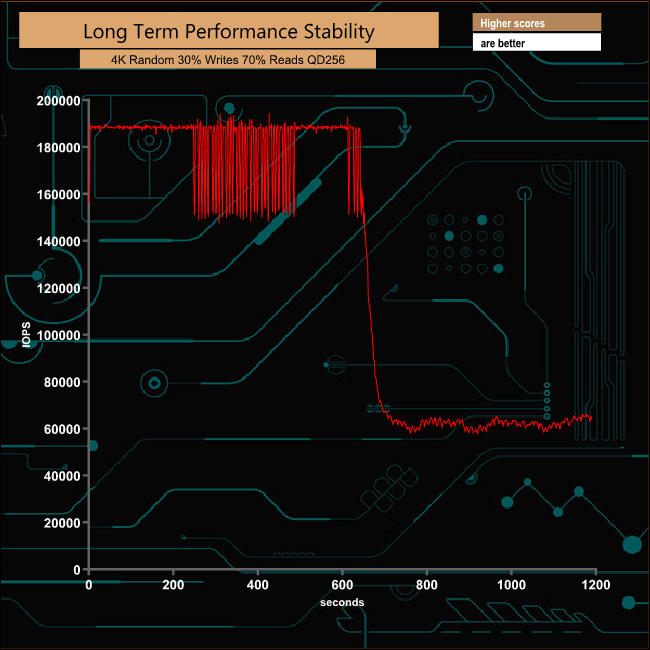
For the long term performance stability test, we set the drive up to run a 20-minute 4K random test with a 30% write/70% read split, at a Queue Depth of 256 over the entire disk. The 960GB MP510 averaged 129,549 IOPS for the test with a performance stability of 68.37%.
To test real life performance of a drive we use a mix of folder/file types and by using the FastCopy utility (which gives a time as well as MB/s result) we record the performance of drive reading from & writing to a 256GB Samsung SSD850 PRO.
We use the following file types:
- 100GB data file.
- 60GB ISO image.
- 60GB Steam folder – 29,521 files.
- 50GB File folder – 28,523 files.
- 12GB Movie folder – 24 files (mix of Blu-ray and 4K files).
- 10GB Photo folder – 621 files (mix of png, raw and jpeg images).
- 10GB Audio folder – 1,483 files (mix of mp3 and .flac files).
- 5GB (1.5bn pixel) photo.
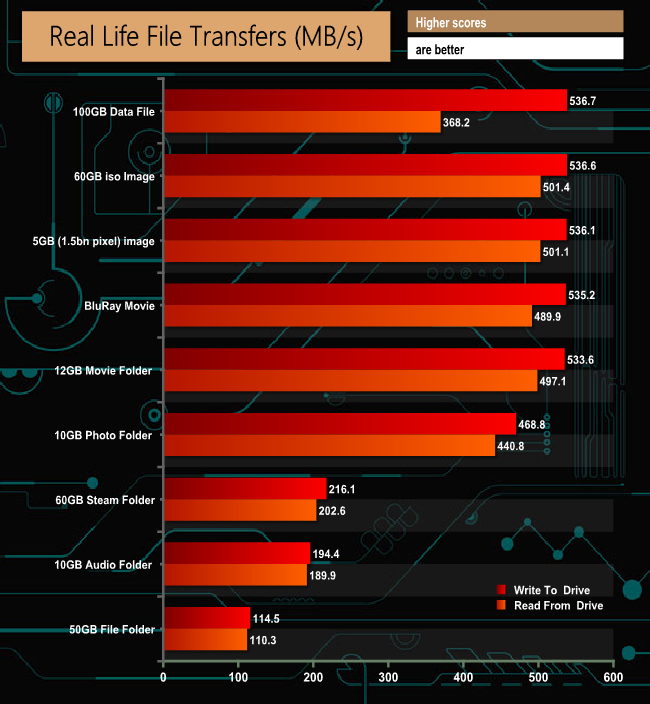
850 Pro Transfers
RD400 Transfers
To get a measure of how much faster PCIe NVMe drives are than standard SATA SSDs we use the same files but transfer to and from a 512GB Toshiba OCZ RD400.
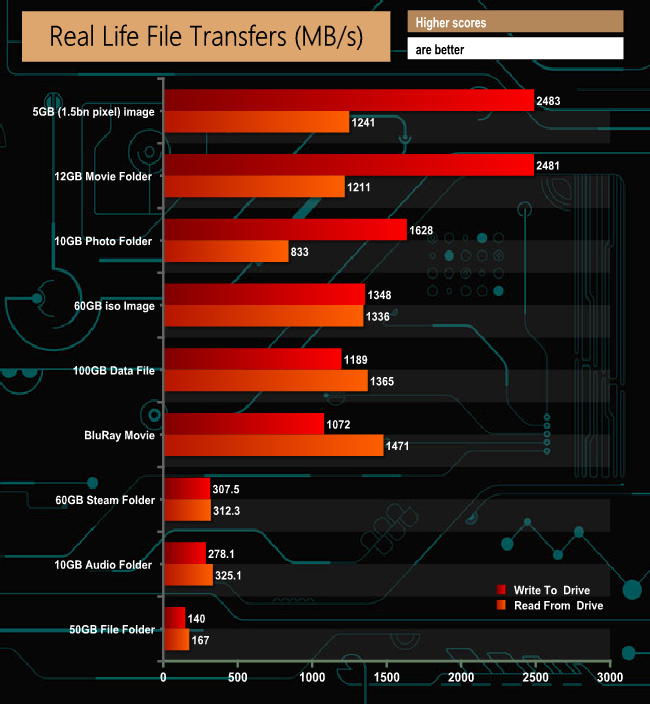
When it comes to dealing with our real life file transfer tests, the drive deals with larger file sizes much more effectively than the small bity files of the 50GB file, 60GB Steam and 10GB audio folders. When writing the larger files to a SATA drive, the MP510 gave over 500MB/s performance for most of them. Switching to writing to another NVMe drive, the transfer rates for the 5GB photo and 12GB movie folder came out at a very impressive at 2,483MB/s and 2,481MB/s respectively.
It's been a while since Corsair launched its first flagship M.2 2280 NVMe drive, the Force MP500, into the market – but now over a year later we have its successor, the Force MP510.
The previous MP500 used a combination of Phison's PS5007-E7 controller and 15nm MLC NAND while the new drive uses the latest 2nd generation Phison NVMe controller in combination with Toshiba's 64-layer 256Gb BiCS3 3D TLC NAND.
The official performance figures for the 960GB MP510 are impressive. Sequential read/writes are quoted at up to 3,480MB/s for reads and up to 3,000MB/s for writes. We could confirm those figures as the review drive when tested with the ATTO benchmark produced 3,414MB/s for reads with writes coming in at 3,012MB/s. Incidentally that Sequential write score is the fastest we've seen from a consumer NVMe M.2 drive to date.
Corsair also quotes some impressive 4K random numbers for the 960GB drive. 4K Random reads are quoted as up to 610,000 IOPS, writes up to 570,000 IOPS. Unfortunately with our random 4K tests we couldn't anywhere near those official figures with 367,239 IOPS being the best read figure we could get with writes at 281,757 IOPS both at a queue depth of 32.
Corsair have been ruthless with the MP510 drive when it comes to competitive pricing. You can find the 960GB version of the MP510 for around £230. Taking the drive that sits above it in our ATTO benchmark graph as an example, WD's Black NVMe 1TB drive retails around some sixty quid more expensive at £293 and the MP510 has a faster Sequential write speed. More to the point it kicks sand in the face of Corsair's own 960GB MP300 (1,600MB/s reads 1,080MB/s) which is only around twenty quid cheaper. It's also light years cheaper than the previous MP500.
You can find the 960GB Corsair MP510 available on Overclockers for £169.99 (inc VAT) HERE (updated April 2019).
Pros
- Overall Performance.
- Sequential write performance.
- Endurance.
- Pricing.
Cons
- Couldn't match those official 4K Random figures.
KitGuru says: It's been a while since we've seen a Corsair drive and it's been well worth the wait. Corsair claims the MP510 is their fastest SSD to date and they're not kidding. Fast, well priced with very good endurance – what's not to like!