Manual CPU Overclocking:
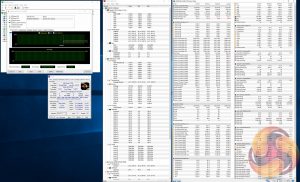
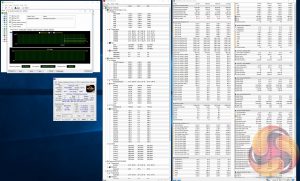
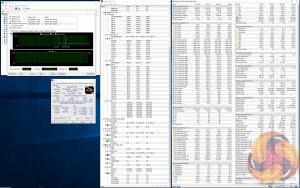
To test the Gigabyte B450 Aorus Pro motherboard’s CPU overclocking potential, we set the CPU core voltage no higher than 1.4V and push for the highest stable clock speed. We maintain the DRAM frequency at 3200MHz to take memory stability out of the overclocking equation. Once the highest clock speed for 1.4V is achieved we see if there is potential to reduce the voltage while maintaining system stability.
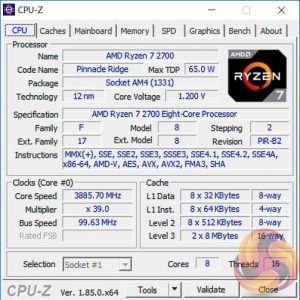
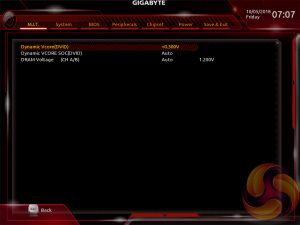
Overclocking with the Gigabyte B450 Aorus Pro was a distinct disappointment as the restrictions within the UEFI meant we weren't able to increase the voltage higher than 1.2v. We'd normally push towards 1.4v to achieve the best possible clock speed – around 4.1GHz.
Gigabyte permits only a positive offset for the VCore voltage of +0.204v, given the base value is 1.0v the maximum final achievable voltage is about 1.2v. With a 1.2v limit we were only able to achieve 3.9GHz, 0.2GHz lower than normal. This restriction was present with both F1 and F2 revisions of the UEFI.
Based on other reviews of this motherboard present online, it seems that the same restriction is not present when using the Ryzen 7 2700X. However, when that CPU is used more voltage is possible, up to 1.4v, although the VRM does seem to get quite toasty in that scenario.
From our testing, even using a modest 1.2v on the vCore, the efficiency had already fallen to approximately 76 per cent (down from 92 per cent at stock) resulting in 25-watts of heat output. Therefore, under higher vCore voltages we'd expect the heat to increase and the efficiency to get worse, thus it's easy to see where overheating issues could originate from when using a Ryzen 7 2700X.
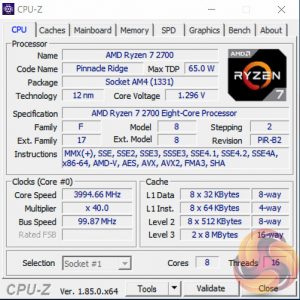
UPDATE 05/10/2018 – Gigabyte issued an updated UEFI version F3B which supports up to 1.3v vCore with the Ryzen 7 2700, by increasing the maximum offset from +0.204v to +0.300v. This enabled us to achieved a final clock speed of 4GHz, rather than 3.9GHz, but it still doesn't constitute enough voltage to achieve 4.1GHz which is the maximum OC for our CPU (with a 1.4v hard vCore limit).
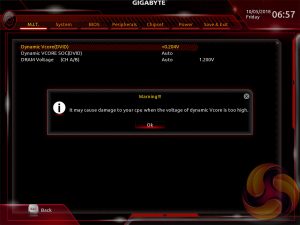
This new BIOS version warns you when exceeding +0.204v for the CPU. Annoyingly it warns you for every increment of 0.006v that you change above the +0.204v threshold, even decreasing from +0.3 to +0.294, so the best approach is just to type in the desired offset, i.e. type “0.3”.
Motherboard Sensors
According to Gigabyte's own monitoring application (Gigabyte System Information Viewer) the sensors correspond to the following components:
- Temperature 1 = System 1
- Temperature 2 = Chipset
- Temperature 3 = CPU
- Temperature 4 = PCIe X16
- Temperature 5 = VRM MOS
- Temperature 6 = VSOC MOS
Based on this information the CPU VRM was 51 degrees Celsius at stock and 63 under overclocked load, the SOC VRM went from 45 to 49.
The VRM does not get hot but with a voltage limit of 1.2v that's hardly an achievement.
With the new UEFI permitting higher voltages those temperatures increase slightly, the CPU VRM rises to 70 and the SOC VRM to 50, both are still comparatively low temperatures.
Overclocked Performance
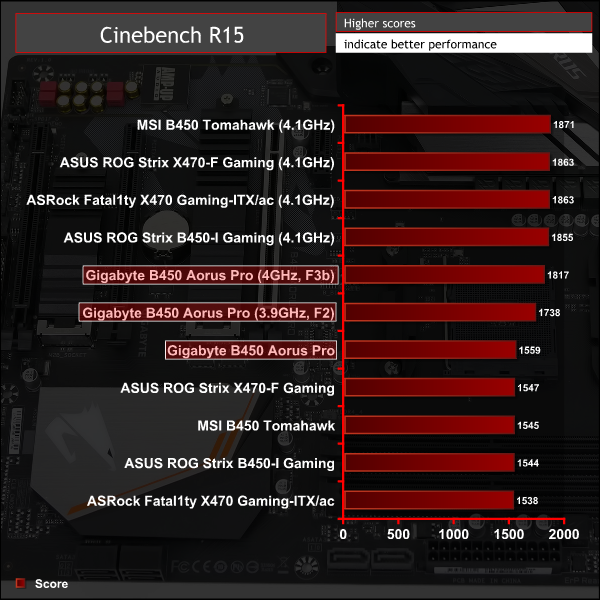
Performance scales as expected with frequency and voltage.
System Power Consumption
We leave the system to idle on the Windows 10 desktop for 10 minutes before taking a reading. For CPU load results we run AIDA64 CPU, FPU, Cache and Memory stress tests and take a reading after 10 minutes. The power consumption of our entire test system (at the wall) is shown in the chart.
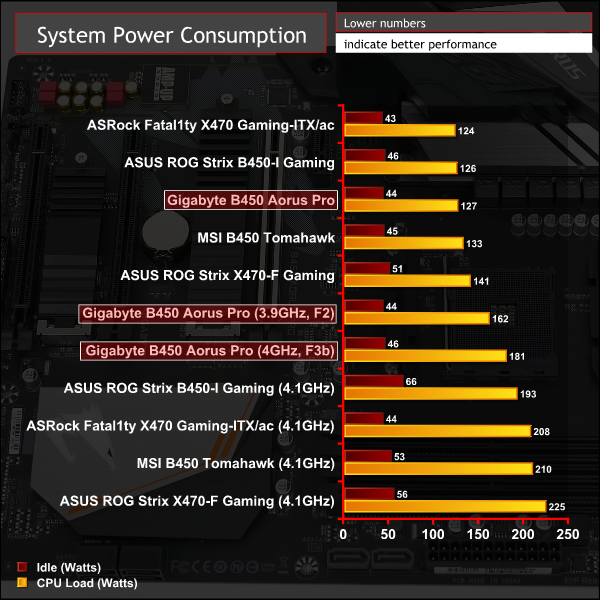
System power consumption was fairly typical at stock and lower than usual at overclocked, reflecting the artificial 1.2v vCore limit. With the new F3b BIOS version permitting up to 1.3v vCore, power consumption jumped by an extra 20-watts.
12-volt EPS Power Consumption
During the 10-minute stress test as specified above, we record the direct CPU power consumption drawn through the EPS 8-pin socket using modified EPS 8-pin cables that have a Tinkerforge Voltage/Current 1.0 bricklet intercepting and monitoring the power flow from the power supply. That bricklet then reports its data to a Tinkerforge Master Brick. All the data collected by the Tinkerforge Master Brick is passed into an external laptop over a USB connection and analysed in the Cybenetics Powenetics Project software.
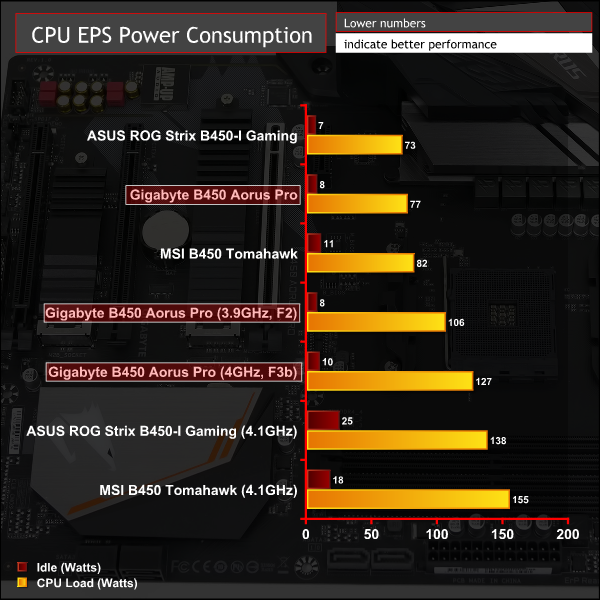
Stock CPU power consumption represents approximately 21% for idle and 68% for load of the system total, when adjusted for PSU efficiency*.
Overclocked CPU power consumption represents approximately 21% for idle and 73% for load of the system total, when adjusted for PSU efficiency*.
*Approximate Seasonic SS-760XP PSU efficiency at:
- 50-watts: 86%
- 125-watts: 89%
- 200-watts: 90%
The Powenetics software provides the power consumption at 12v input (pre-CPU VRM), and the Ryzen CPU provides the power consumption (CPU Package Power) after the CPU VRM has translated the power into a useful format (post-VRM). Based on this we can provide a rough estimate of VRM efficiency and “wasted” energy that likely translates into heat.
- Stock: 71-watts reported by CPU, 77-watts recorded, approximately 92% efficient and 6-watts of heat output.
- Overclocked (F2): 81-watts reported, 106-watts recorded, approximately 76% efficient and 25-watts of heat output.
- Overclocked (F3b): 89-watts reported, 127-watts recorded, approximately 70% efficient and 38-watts of heat output.
 KitGuru KitGuru.net – Tech News | Hardware News | Hardware Reviews | IOS | Mobile | Gaming | Graphics Cards


