Manual CPU Overclocking:
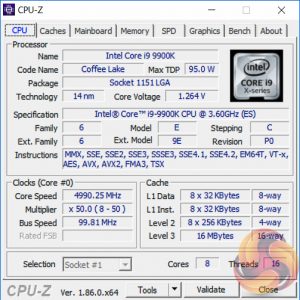
To test the EVGA Z390 FTW motherboard’s CPU overclocking potential, we set the CPU core voltage no higher than 1.3V and push for the highest stable clock speed. We maintain the DRAM frequency at 3200MHz to take memory stability out of the overclocking equation.
Our particular CPU is not stable at 5.1GHz even with 1.45v. The final stable overclock for almost all Z390 motherboards we may test should be 5GHz, unless there is something particularly wrong with the VRM that limits the voltage or power it can supply. In the case of the EVGA Z390 FTW it achieved 5GHz at 1.28 volts with no significant issues.
Motherboard Sensors
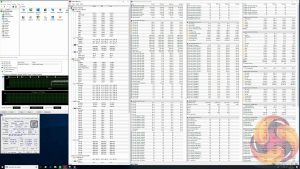
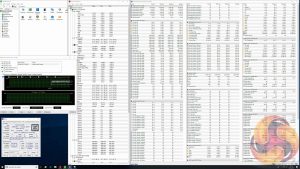
EVGA provides VRM sensors with the Z390 FTW which enabled us to observe that the VRM temperatures did not reach 70 degrees Celsius during testing, which is very respectable.
The VRM sensors also provide power input and output statistics which, if they are to be believed, imply the VRM is only operating at about 75 per cent efficiency – 168-watts in and 128-watts out at stock, 155 watts-in and 116-watts out at our overclocked load settings.
Overclocked Performance
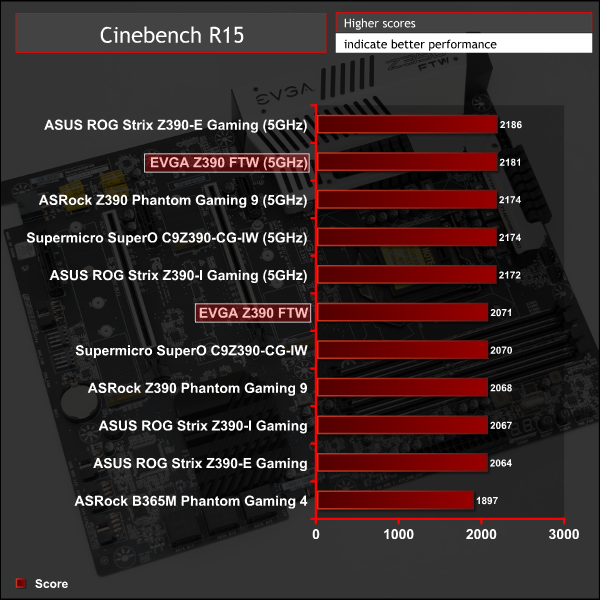
System Power Consumption
We leave the system to idle on the Windows 10 desktop for 10 minutes before taking a reading. For CPU load results we run AIDA64 CPU, FPU, Cache and Memory stress tests and take a reading after 10 minutes. The power consumption of our entire test system (at the wall) is shown in the chart.
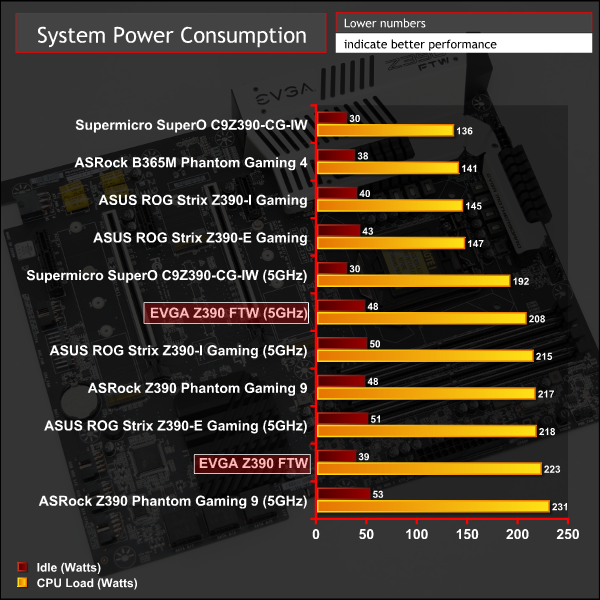
CPU power consumption actually fell during overclocking, which is corroborated by the sensor data above.
12-volt EPS Power Consumption
During the 10-minute stress test as specified above, we record the direct CPU power consumption drawn through the EPS 8-pin socket using modified EPS 8-pin cables that have a Tinkerforge Voltage/Current 1.0 bricklet intercepting and monitoring the power flow from the power supply. That bricklet then reports its data to a Tinkerforge Master Brick. All the data collected by the Tinkerforge Master Brick is passed into an external laptop over a USB connection and analysed in the Cybenetics Powenetics Project software.
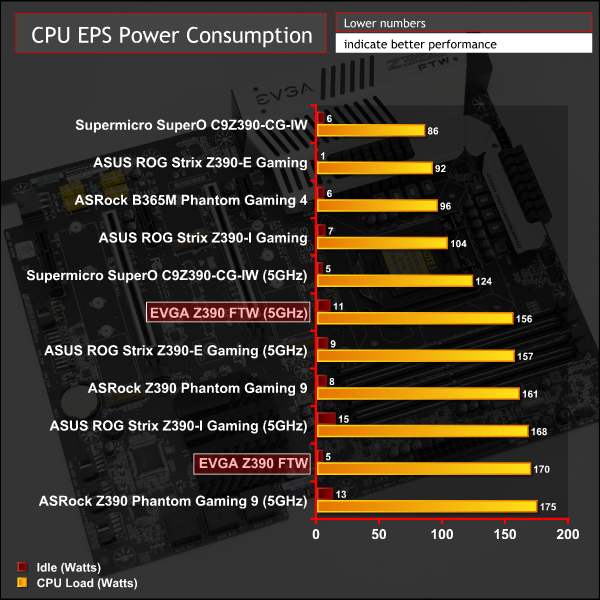
Similarly, power consumption measured at the 8pin EPS connector showed a similar drop when overclocking.
The one peculiarity is that the “VID” and “VCore” both increased when overclocking, compared to stock, yet power consumption decreased for the CPU as a whole. It is not immediately clear what explains this irregularity but either way the “optimised defaults” setup is clearly not optimal when it comes to the balance between performance and power consumption.
 KitGuru KitGuru.net – Tech News | Hardware News | Hardware Reviews | IOS | Mobile | Gaming | Graphics Cards
