Manual CPU Overclocking:
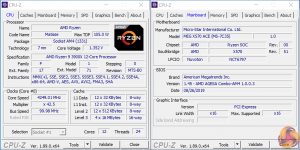
To test the MSI MEG X570 ACE motherboard’s CPU overclocking potential, we set the CPU Core Voltage to 1.35V and applied the Mode 2 LLC setting.
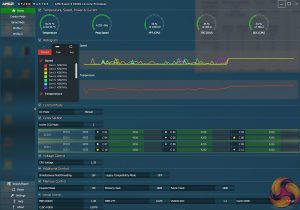
We were able to hit a stable frequency of 4250MHz using 1.35V as set in the UEFI. We applied the Mode 2 load-line calibration setting as this resulted in a load voltage of 1.352V, according to CPU-Z and 1.35V according to Ryzen Master.
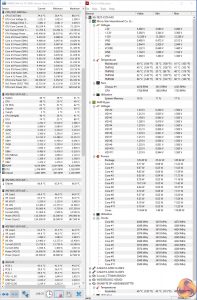
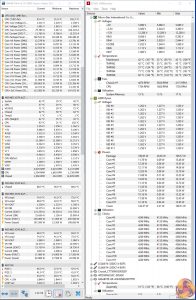
Interestingly, the sensor data suggested that MSI’s MEG X570 ACE was using around 190W CPU package power for this frequency and voltage, whereas Gigabyte’s X570 Aorus Master demanded around 20W less. The implication here is that the voltage reading delivered by CPU-Z is unlikely to be correct. Unfortunately, we cannot validate that point as MSI does not equip this motherboard with onboard voltage reading points, which is highly disappointing.
Dropping down to Mode 3 LLC in an attempt to reduce CPU package power draw resulted in a software-read CPU core voltage of around 1.335V. However, this configuration quickly locked up and proved unstable under AIDA64 stress testing. We settled for 4250MHz at 1.35V with Mode 2 LLC and a surprisingly high CPU package power reading.
Motherboard Sensors
Overclocked Performance
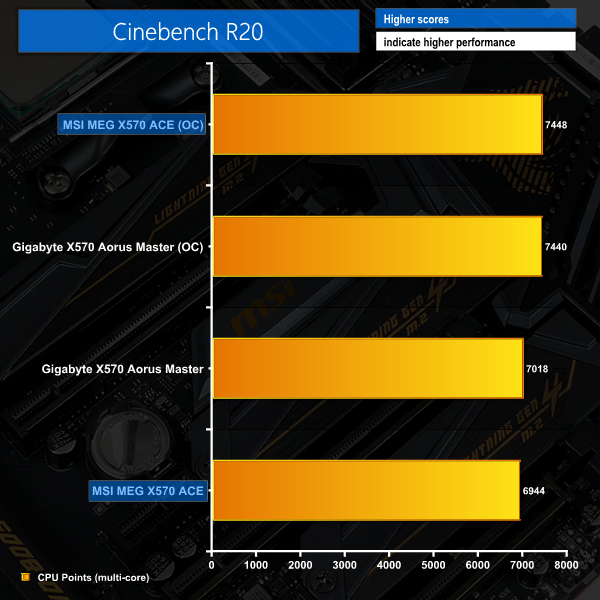
With the Ryzen 9 3900X CPU’s speed boosted to 4.25GHz by MSI’s MEG X570 ACE motherboard, Cinebench R20 multi-core performance increases by a solid 504 points or 7%.
As is always the case with Ryzen 3000, this type of overclock is better suited for heavy multi-core workloads as the single-core boost speed is reduced. It’s also worth looking into the PBO performance of your individual CPU.
System Power Consumption
We leave the system to idle on the Windows 10 desktop for 10 minutes before taking a reading. For CPU load results we run AIDA64 CPU, FPU, and Cache stress tests and take a reading. The power consumption of our entire test system (at the wall) is shown in the chart.
A little less power draw for the MSI board compared to Gigabyte’s is unsurprising as the ACE’s CPU frequency and performance in multi-core workloads was a little lower. The VRM efficiency looks to be strong based on a comparison with a competing X570 solution.
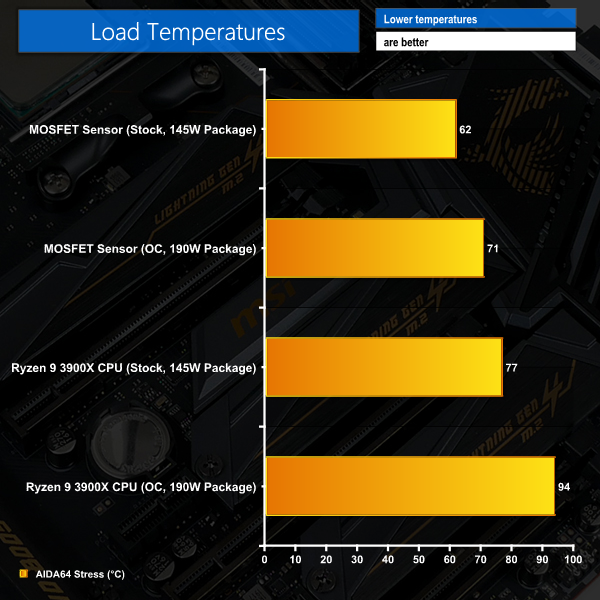
Overclocking forced power consumption higher than we’d have liked, presumably due to higher voltages being fed to the CPU than what the software was telling us. Without onboard voltage monitoring points, we could not accurately check the real CPU voltage but we could see the reported 190W package power draw from software. That’s around 20W higher than what we saw from Gigabyte’s overclocked competitor.
Either way, MSI’s motherboard was adequately equipped to handle this level of power throughout our testing.
System Temperatures
We run the AIDA64 CPU stress test for 1 hour while recording the system data using HWInfo. This data is then analysed to show the CPU temperatures and also the VRM MOSFET temperatures, when the sensor data is available.
MOSFET temperatures were well within safe limits thanks to MSI’s strong combined heatsink design. The VRM and CPU did get a little hotter than we anticipated under overclocked load but this was primarily due to the higher amount of power shifting through the system versus Gigabyte’s competitor.
Again, the lack of onboard voltage monitoring points is disappointing in this scenario as we couldn’t accurately check CPU voltage and compensate accordingly.
 KitGuru KitGuru.net – Tech News | Hardware News | Hardware Reviews | IOS | Mobile | Gaming | Graphics Cards
