Power Consumption
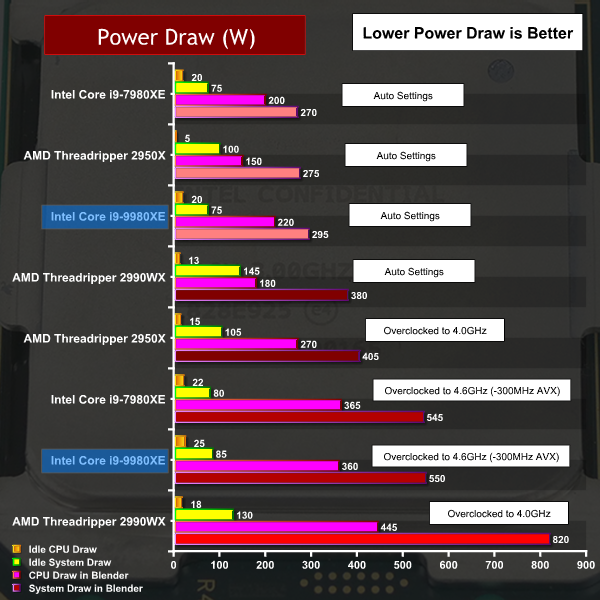
We monitor CPU power draw using Powenetics project software from Cybenetics which means we are able to monitor both the overall system power and also the power that is feeding directly to the CPU cores.
Power Consumption Overview
If you are in the market for a Threadripper WX our chart will show you the downside as that huge number of cores requires plenty of power. When you overclock Threadripper WX the power draw more than doubles and indicates that Auto settings make the most sense unless you have extreme requirements for CPU performance.
At stock clock speeds Core i9-9980XE draws some 20W more than Core i9-7980XE under load, which is a simple reflection of the higher core voltage and increased clock speed. When both CPUs are overclocked to 4.6GHz the power figures equalise, exactly as you would expect.
Temperatures
Temperature Overview
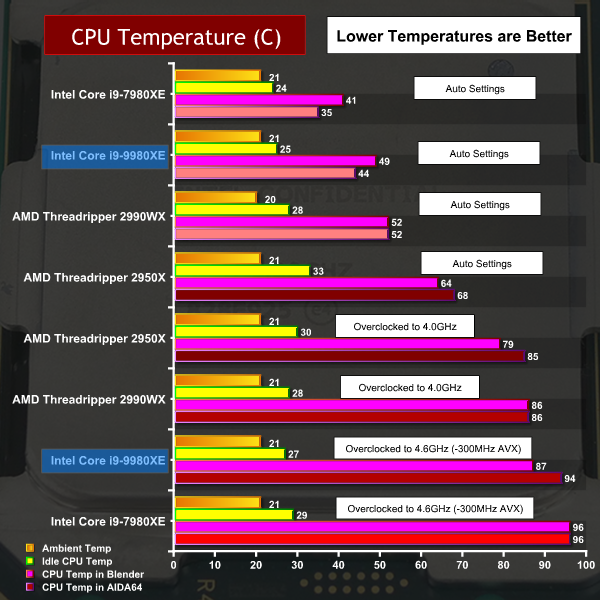
You can draw a number of conclusions from our temperature chart, however we doubt you would guess the i9-9980XE is packaged differently to the i9-7980XE. It is quite bizarre how the use of a soldered heat spreader makes very little difference to the thermal performance of the 18-core CPU.
The one area of difference we can see comes when we overclocked both CPUs to 4.6GHz and then hammered them in Blender as the i9-9980XE remained below 90 degrees while i9-7980XE was desperately close to 100 degrees.
It is clear that Intel has used every last scrap of thermal headroom to raise performance to the limits. Flipping this the other way around, it wouldn’t have made much sense to release i9-9980XE at the same clock speed as i9-7980XE with lower temperatures saying ‘look, it runs cooler’ however the results look unimpressive on the page and especially when you run both CPUs on Auto settings.
 KitGuru KitGuru.net – Tech News | Hardware News | Hardware Reviews | IOS | Mobile | Gaming | Graphics Cards


