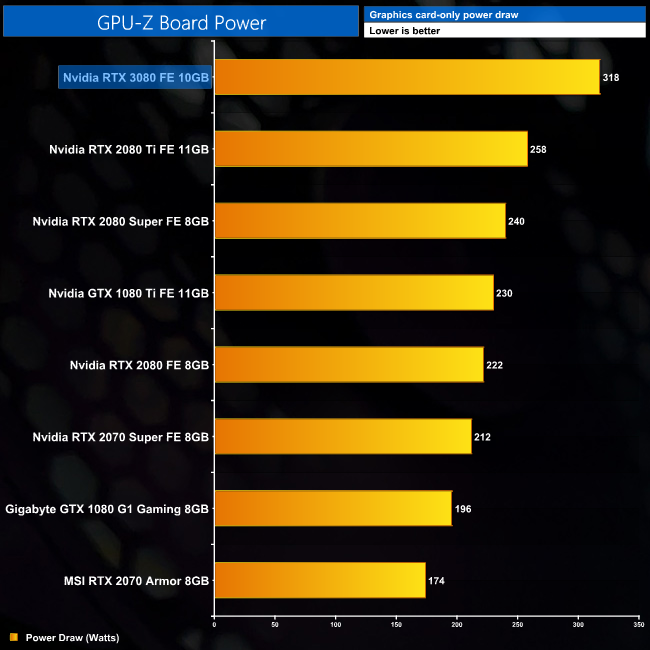
Following on from our total system power draw testing on the previous page, we re-ran some of our tests, this time looking at the Board Power metric as reported by GPU-Z. This is currently only available for Nvidia cards, which is why we have excluded AMD results from the chart. Aside from the fact this is software-based reporting, and not a hardware measurement of the PCIe power cables and PCIe slot (for that we'd need something like PCAT), this should provide us more accurate data to work with as it is measuring only the GPU power, and not total system power which is a fundamentally imprecise measurement.
First up, here is the average Board Power for all of the Nvidia GPUs we tested, measured across a 30-minute 3DMark Time Spy run.
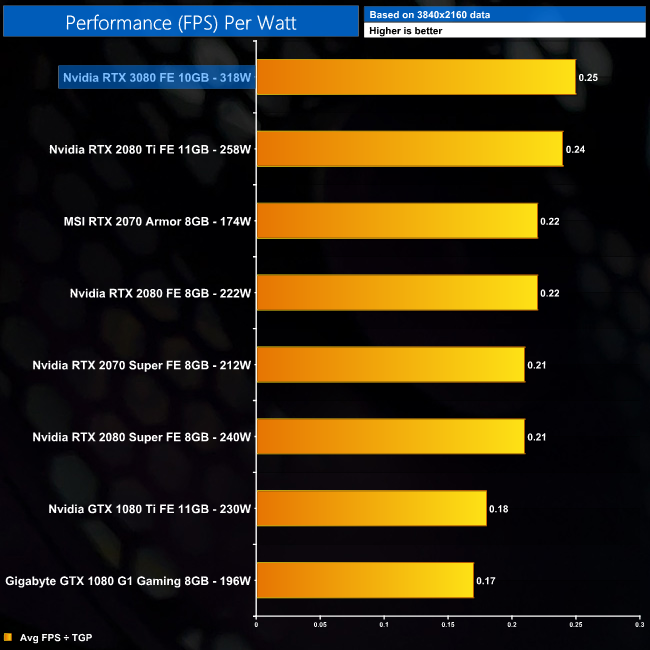
Then, by using this data in conjunction with the 11-game average FPS data we presented earlier in this review, we can work out performance per Watt for each graphics card. This is presented as FPS per Watt.
The data here more-or-less confirms our thoughts from the previous page, namely that the RTX 3080 sees a larger (13%) performance per Watt improvement when compared to the RTX 2080, than it does compared to the RTX 2080 Ti (just 4%). It is still an improvement, yes, but it is clear Ampere is all about the performance, with efficiency gains seemingly less of a priority here.
 KitGuru KitGuru.net – Tech News | Hardware News | Hardware Reviews | IOS | Mobile | Gaming | Graphics Cards


