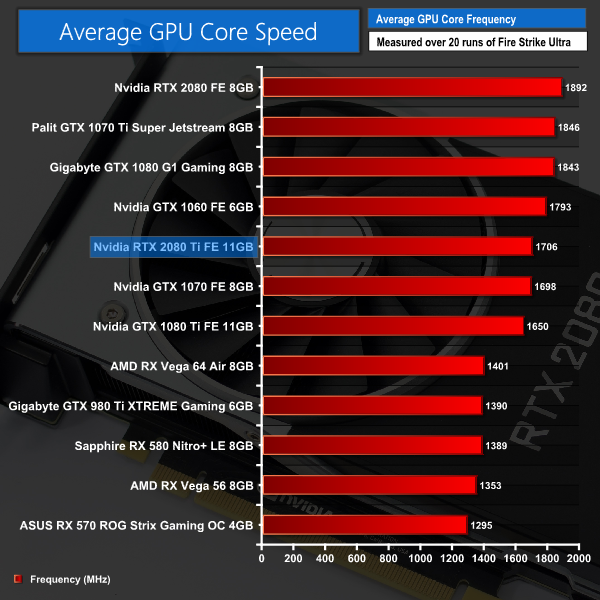
Here we present the average clock speed for each graphics card while running the 3DMark Fire Strike Ultra stress test 20 times. We use GPU-Z in tandem with the Powenetics Project (see the previous page) to record the GPU core frequency during the Fire Strike Ultra runs – at the end, we are left with around 4300 data entries. We calculate the average core frequency during the entire 20-run test to present here.
Turing is obviously a new architecture, so we can't directly compare the clock speed shown here with figures from Pascal or other cards. Over the next few weeks and months, when we will review a number of aftermarket cards, it will be interesting to have this information however, as we will then be able to see just how much faster those aftermarket cards are.
 KitGuru KitGuru.net – Tech News | Hardware News | Hardware Reviews | IOS | Mobile | Gaming | Graphics Cards


