Driver Notes
- All AMD GPUs were benchmarked with the Adrenalin 22.10.3 driver.
- All Nvidia GPUs (except RTX 4080) were benchmarked with the 526.61 driver.
- RTX 4080 was benchmarked with the 527.72 driver supplied to press.
Benchmark results are only comparable where this exact configuration has been used.
Test System:
We test using a custom built system powered by MSI, based on Intel’s Alder Lake platform. You can read more about this system HERE and check out MSI on the CCL webstore HERE.
| CPU |
Intel Core i9-12900K
|
| Motherboard |
MSI MEG Z690 Unify
|
| Memory |
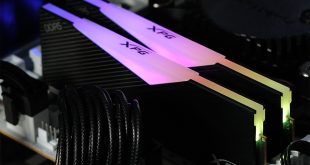
32GB (2x16GB) ADATA XPG Lancer DDR5 6000MHz
CL 40-40-40
|
| Graphics Card |
Varies
|
| SSD |
2TB MSI Spatium M480
|
| Chassis | MSI MPG Velox 100P Airflow |
| CPU Cooler |
MSI MEG CoreLiquid S360
|
| Power Supply |
Corsair 1200W HX Series Modular 80 Plus Platinum
|
| Operating System |
Windows 11 Pro 21H2
|
| Monitor |
MSI Optix MPG321UR-QD
|
| Resizable BAR |
Enabled for all supported GPUs
|
Comparison Graphics Cards List
- Sapphire RX 6950 XT Nitro+ 16GB
- AMD RX 6900 XT 16GB
- AMD RX 6800 XT 16GB
- Nvidia RTX 4090 Founders Edition 24GB
- Nvidia RTX 4080 Founders Edition 16GB
- Gigabyte RTX 4080 Gaming OC 16GB
- Inno3D RTX 4080 iChill X3 16GB
- Palit RTX 4080 GameRock OC 16GB
- Gigabyte RTX 3090 Ti Gaming 24GB
- Gigabyte RTX 3090 Eagle 24GB
- Nvidia RTX 3080 Ti Founders Edition 12GB
- Gigabyte RTX 3080 Eagle 10GB
All cards (except RTX 4080 AIB models) were tested at reference specifications.
Software and Games List
- 3DMark Fire Strike & Fire Strike Ultra (DX11 Synthetic)
- 3DMark Time Spy (DX12 Synthetic)
- 3DMark DirectX Raytracing feature test (DXR Synthetic)
- Assassin's Creed Valhalla (DX12)
- Cyberpunk 2077 (DX12)
- Days Gone (DX11)
- Dying Light 2 (DX12)
- Far Cry 6 (DX12)
- Forza Horizon 5 (DX12)
- God of War (DX11)
- Horizon Zero Dawn (DX12)
- Marvel's Spider-Man Remastered (DX12)
- Metro Exodus Enhanced Edition (DXR)
- Red Dead Redemption 2 (DX12)
- Resident Evil Village (DX12)
- Total War: Warhammer III (DX11)
We run each benchmark/game three times, and present mean averages in our graphs. We use FrameView to measure average frame rates as well as 1% low values across our three runs.
 KitGuru KitGuru.net – Tech News | Hardware News | Hardware Reviews | IOS | Mobile | Gaming | Graphics Cards


