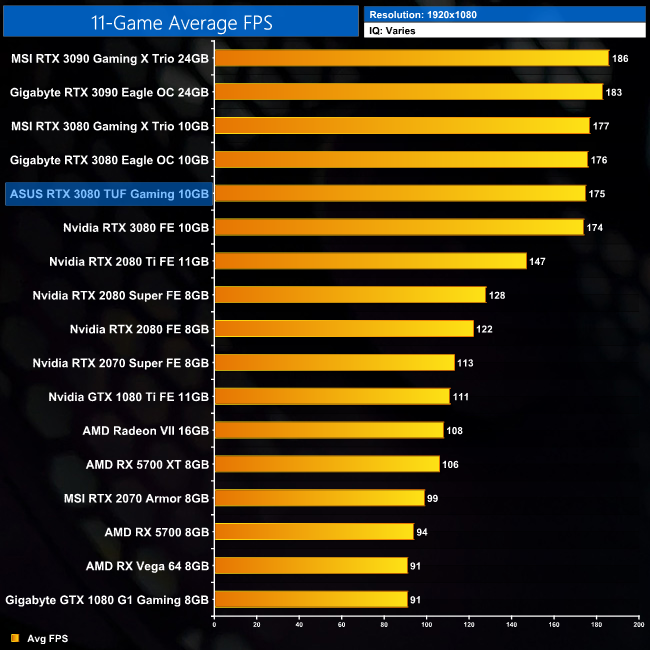
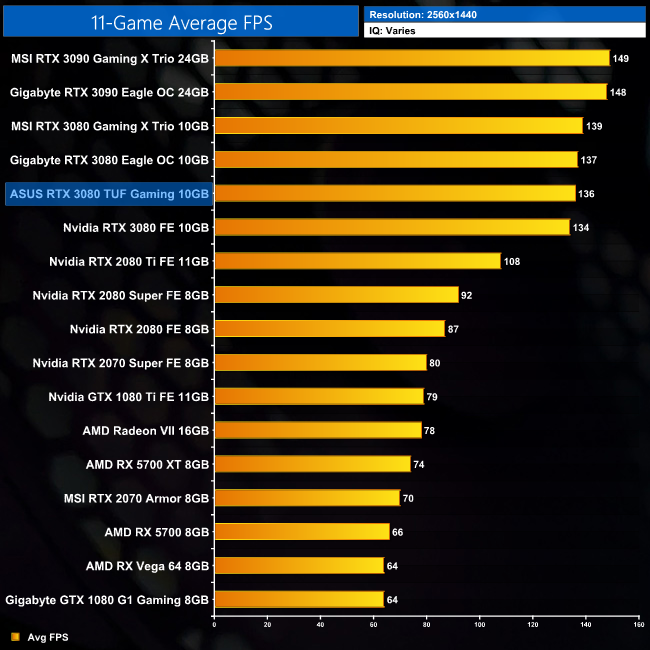
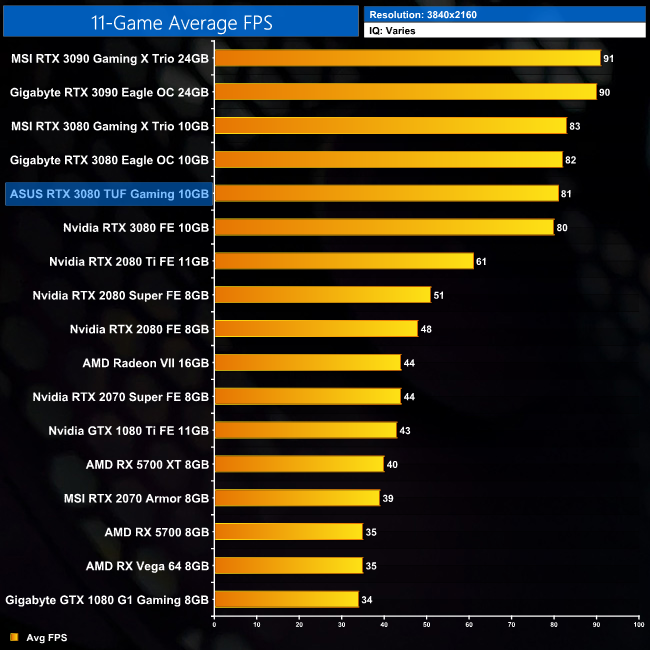
Here we present frame rate figures for each graphics card, averaged across all 11 games on test today. These figures can disguise significant variations in performance from game to game, but provide a useful overview of the sort of performance you can expect at each resolution tested.
In terms of our average FPS, it's not a shock to see performance of all four RTX 3080s is very similar. At 4K, there's just a 3FPS margin between all four cards – the TUF Gaming is 1% faster than the Founders Edition, but it is also 2% slower than the MSI RTX 3080 Gaming X Trio.
 KitGuru KitGuru.net – Tech News | Hardware News | Hardware Reviews | IOS | Mobile | Gaming | Graphics Cards


