Our newest GPU test procedure has been built with the intention of benchmarking high-end graphics cards. We test at 1920×1080 (1080p), 2560×1440 (1440p), and 3840×2160 (4K UHD) resolutions.
We try to test using the DX12 API if titles offer support. This gives us an interpretation into the graphics card performance hierarchy in the present time and the near future, when DX12 becomes more prevalent. After all, graphics cards of this expense may stay in a gamer’s system for a number of product generations/years before being upgraded.
We tested the RX Vega64 and Vega56 using the ‘Turbo‘ power mode in AMD’s WattMan software. This prioritises all-out performance over power efficiency, noise output, and lower thermals.
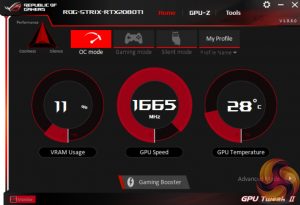
As mentioned, the Strix runs at 1650MHz out of the box, but we tested with OC mode enabled within GPU Tweak II, giving a boost clock of 1665MHz.
We did the bulk of our testing using the card’s performance BIOS to get the most from the card. We did re-run some tests using the quiet BIOS – including all of our 4K gaming benchmarks – to see what performance difference it made. Each result for the card is clearly marked depending on what BIOS was used.
It is also worth clarifying that clock speed is not affected by choice of BIOS – so we used both with the 1665MHz OC mode enabled. However, we can expect a significantly quieter fan curve to cause the GPU to run hotter, thus affecting how far GPU Boost 4.0 will take the clock speed. How much of a difference that will make (if any) is what we are testing today.
Driver Notes
- AMD graphics cards were benchmarked with the Adrenalin 18.9.1 driver.
- Nvidia graphics cards (apart from RTX 20 series cards) were benchmarked with the Nvidia 399.24 driver.
- RTX 2080 and 2080 Ti cards were benchmarked with the Nvidia 411.63 driver.
- RTX 2070 cards were benchmarked with the Nvidia 416.33 driver.
Test System
We test using the Overclockers UK Germanium pre-built system. You can read more about it over HERE. It is important to note we have had to re-house the components to an open-air test bench to accommodate our new GPU power testing (more on that later) but the core of the system is unchanged and the performance figures you see presented here are what you can expect from the Germanium.
| CPU |
Intel Core i7-8700K
Overclocked to 4.8GHz |
| Motherboard |
ASUS ROG Strix Z370-F Gaming
|
| Memory |
Team Group Dark Hawk RGB
16GB (2x8GB) @ 3200MHz 16-18-18-38 |
| Graphics Card |
Varies
|
| System Drive |
Patriot Wildfire 240GB
|
| Games Drive | Crucial M4 512GB |
| Chassis | Streacom ST-BC1 Bench |
| CPU Cooler |
OCUK TechLabs 240mm AIO
|
| Power Supply |
SuperFlower Leadex II 850W 80Plus Gold
|
| Operating System |
Windows 10 Professional
|
Comparison Graphics Cards List
- Nvidia RTX 2080 Ti Founders Edition (FE) 11GB
- Nvidia RTX 2080 Founders Edition (FE) 8GB
- Gigabyte RTX 2080 Gaming OC 8GB
- Palit RTX 2080 GameRock Premium 8GB
- ASUS ROG RTX 2080 Strix OC 8GB
- Gigabyte Aorus RTX 2080 Xtreme 8GB
- MSI RTX 2070 Gaming Z 8GB
- MSI RTX 2070 Armor 8GB
- Nvidia GTX 1080 Ti Founders Edition (FE) 11GB
- Gigabyte GTX 1080 G1 Gaming 8GB
- Palit GTX 1070 Ti Super Jetstream 8GB
- Nvidia GTX 1070 Founders Edition (FE) 8GB
- Nvidia GTX 1060 Founders Edition (FE) 6GB
- Gigabyte GTX 980 Ti XTREME Gaming 6GB
- AMD RX Vega 64 Air 8GB
- AMD RX Vega 56 8GB
- Sapphire RX 580 Nitro+ Limited Edition (LE) 8GB
- ASUS RX 570 ROG Strix Gaming OC 4GB
Software and Games List
- 3DMark Fire Strike & Fire Strike Ultra (DX11 Synthetic)
- 3DMark Time Spy (DX12 Synthetic)
- Deus Ex: Mankind Divided (DX12)
- Far Cry 5 (DX11)
- Tom Clancy’s Ghost Recon: Wildlands (DX11)
- Middle Earth: Shadow of War (DX11)
- Shadow of the Tomb Raider (DX12)
We run each benchmark/game three times, and present averages in our graphs.
 KitGuru KitGuru.net – Tech News | Hardware News | Hardware Reviews | IOS | Mobile | Gaming | Graphics Cards


