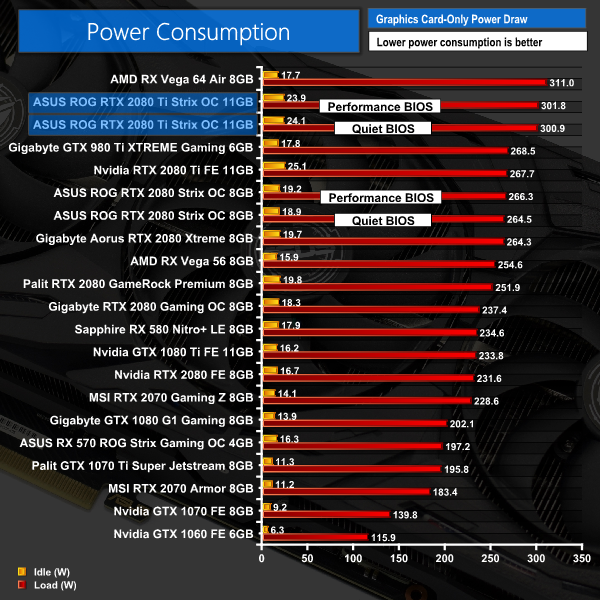
We have recently revamped our GPU power consumption testing. Previously we would measure the total system power draw with each graphics card installed. Given that the rest of the components did not change, this gave us an idea of the relative power consumption of each graphics card, but we could not be more specific than that.
Now, however, thanks to Cybenetics Labs and its Powenetics Project, we are able to measure the power consumption of the graphics card alone, giving much more precise and accurate data. Essentially, this works by installing sensors in the PCIe power cables, as well as the PCIe slot itself thanks to a special riser card. This data is recorded using specialist software provided by Cybenetics Labs and given it polls multiple times a second (between 6 and 8 times a second, based on my observations) we can track the power consumption in incredible detail over any given amount of time.
You can read more about the Powenetics Project over HERE.
As with previous testing, a reading under load comes from running the 3DMark Fire Strike Ultra stress test 20 times. An idle reading comes after leaving the system on the Windows desktop for 30 minutes. This stress test (20 runs) produces approximately 4300 data entries in the Powenetics software, which we can then export to an Excel file and analyse further. Here we present the average continuous power consumption of each graphics card across the entire 20 run test.
The Strix 2080 Ti is certainly a power-hungry card – neither BIOS makes much difference, with both drawing just over 300W. This means it only draws 10-11W less than a Vega64, although performance is significantly better than the Vega64 as well which is worth remembering when looking at the power figures. In any case, I doubt very much that an extra few pounds a month on the electricity bill is going to bother anyone that would spend £1500 on a graphics card in the first place.
 KitGuru KitGuru.net – Tech News | Hardware News | Hardware Reviews | IOS | Mobile | Gaming | Graphics Cards


