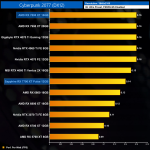
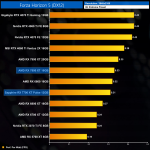
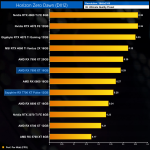
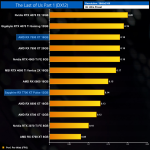
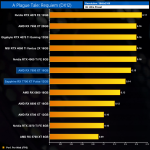
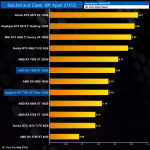
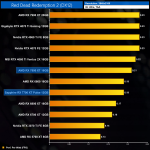
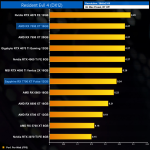
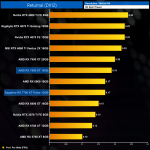
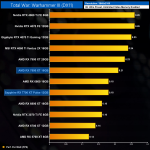
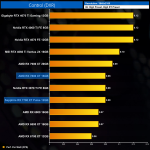
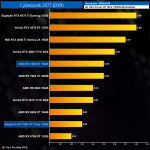
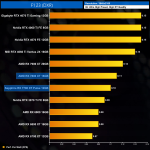
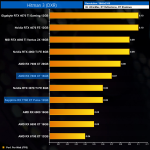
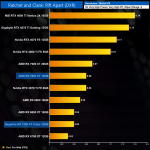
Using the graphics card-only power draw figures presented earlier in the review, here we present performance per Watt on a per-game basis for all twelve games we tested at 2160p (4K).
Per-Game Results at 2160p (4K):
Click to enlarge.
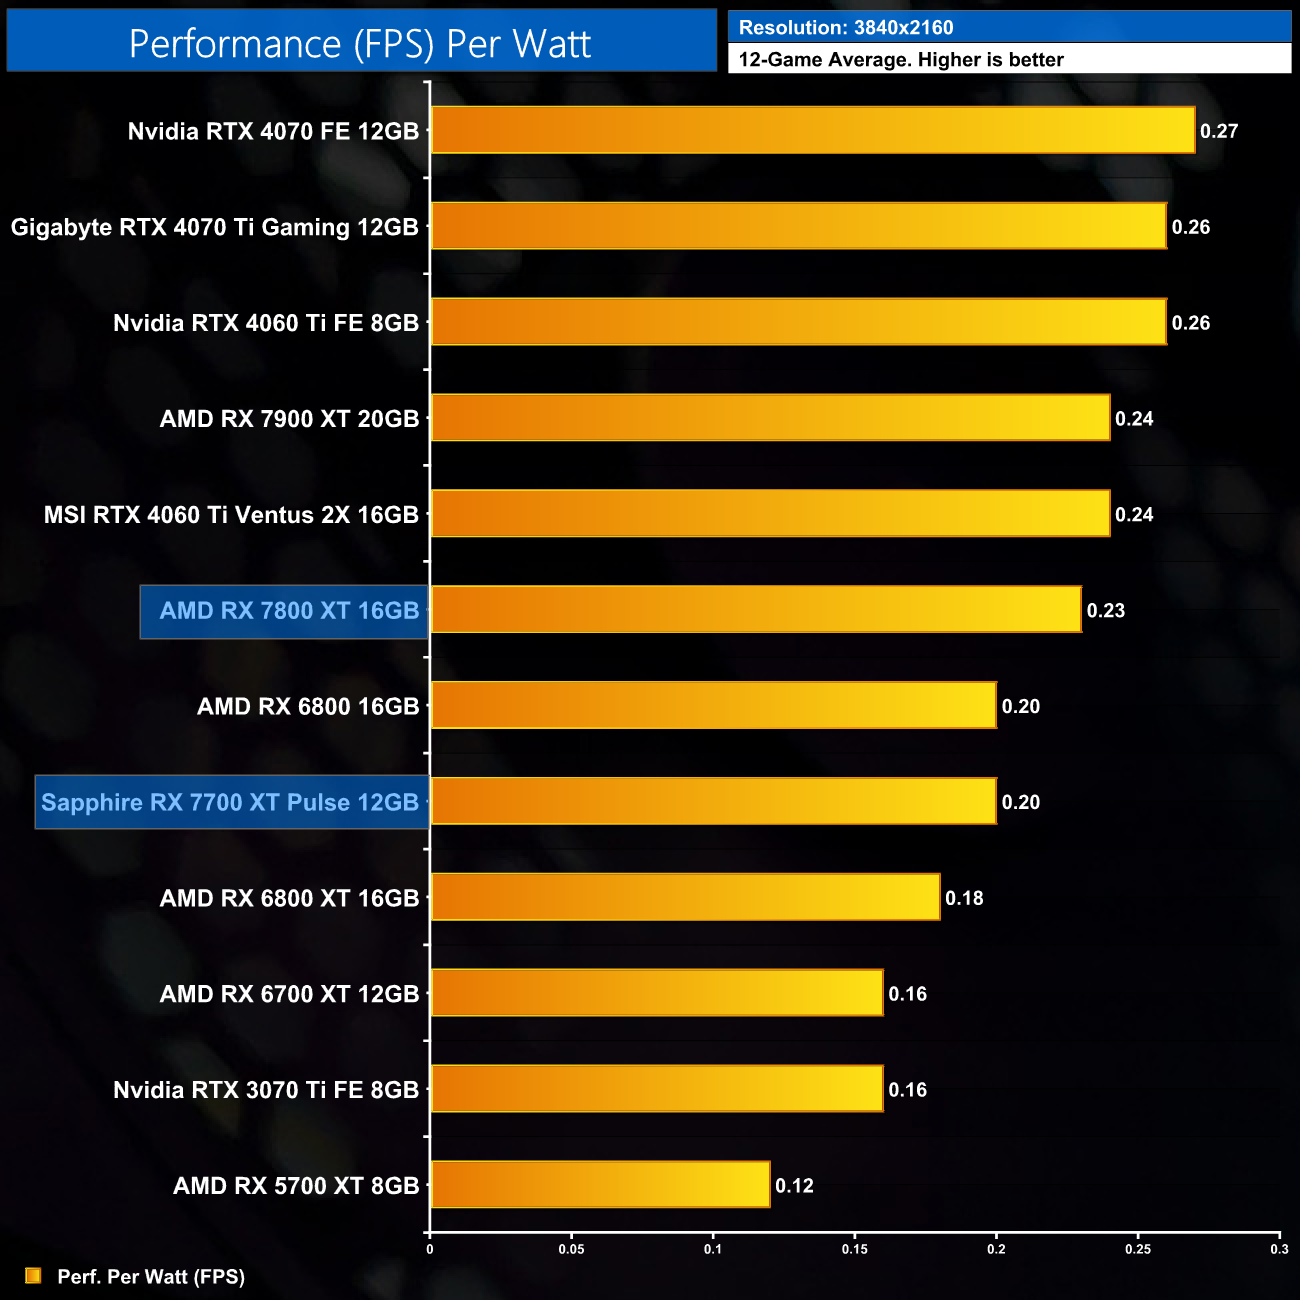
12-Game Average at 2160p (4K):
Lastly, at 4K the performance per Watt is now a touch behind the RX 7800 XT, coming 14% lower, while it's still about 17% worse than the RTX 4060 Ti 16GB.
Ray tracing results
As a bonus, we now include the power figures for all eight games we test with ray tracing enabled.
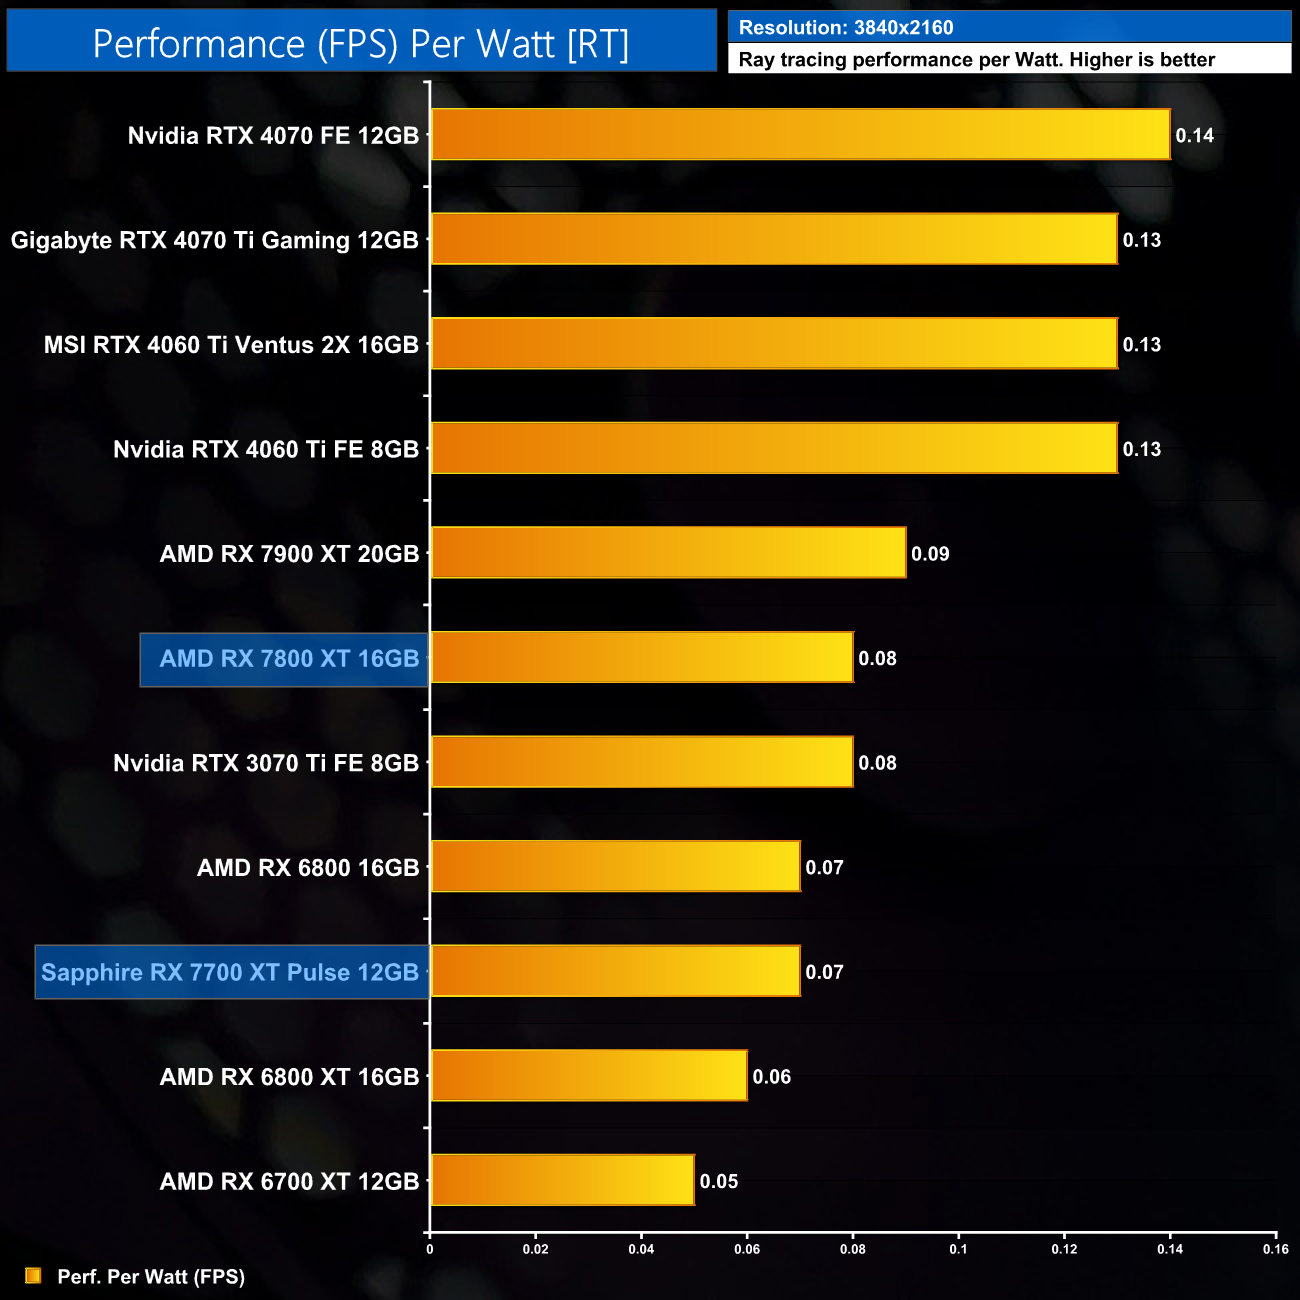
8-Game ray tracing average:
The same can be said at 4K with RT enabled – Nvidia is clear at the top of the chart.
 KitGuru KitGuru.net – Tech News | Hardware News | Hardware Reviews | IOS | Mobile | Gaming | Graphics Cards


