We leave the system to idle on the Windows 10 desktop for 5 minutes before taking a power draw reading. For CPU load results, we read the power draw while producing five runs of the Cinebench multi-threaded test as we have found it to push power draw and temperature levels beyond those of AIDA 64 and close to Prime 95 (non-AVX) levels. Even five continuous loops of Cinebench results in a short run time on high-performance CPUs which influences the validity of the temperature reading, so we run 5 minutes of AIDA64 stress test to validate data.
The power consumption of our entire test system (at the wall) is shown in the chart. The same test parameters were used for temperature readings.
Power Consumption
Power draw readings are accurate to around +/-5-10W under heavy load due to instantaneous fluctuations in the value. We use a Platinum-rated Seasonic 760W PSU (with 8-pin plus 4-pin power connectors where possible) and install a GTX 1070 video card that uses very little power.
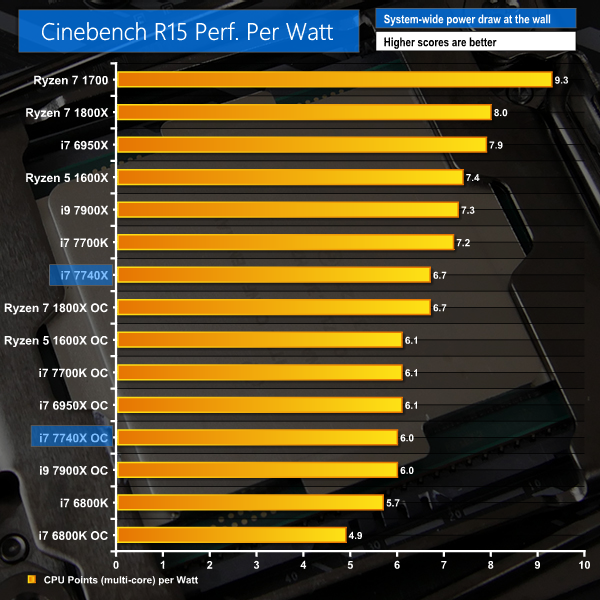
Power consumption from the four-core, eight-thread i7-7740X is reasonable at less than 150W system-wide whilst rendering in Cinebench R15. The Kaby Lake-X system demands around 10% more power than its Kaby Lake 7700K alternative and this is most likely down to the CPU as both test motherboards were models from ASUS.
AMD's Ryzen 7 1700 is close to the 7740X when looking at system power draw during Cinebench. This speaks volumes for the efficiency of AMD's Zen architecture at the moderate operating speeds of the eight-core, sixteen-thread Ryzen 7 1700.
Overclocked to 5.1GHz, the 7740X system pushes slightly past 180W from the wall when loaded. This still makes it less power hungry than the six-core 6800K system or an eight-core Ryzen 7 1800X-based system, for example. There are no PSU-busting numbers on display from the Kaby Lake-X 7740X.
Cinebench-led performance efficiency for the Core i7-7740X is poor. This is because the four-core chip is, in essence, heavily overclocked from the factory. Rendering efficiency in Cinebench scales better with a larger number of lower-clocked cores which will typically demand less power consumption.
If you are concerned about getting the best productivity performance per unit energy, the Core i7-7740X is not the CPU to purchase, based on our Cinebench-led numbers. AMD's similarly-priced Ryzen 7 1700 would take that crown.
Temperatures
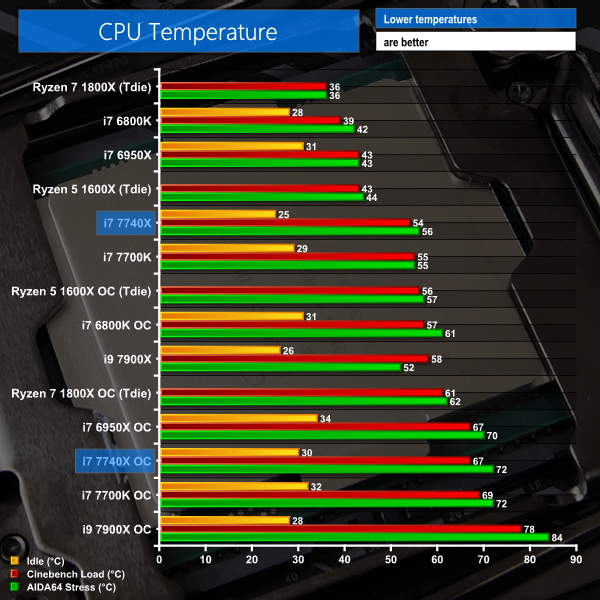
Temperature recordings were taken using a 280mm Corsair H110i GT all-in-one liquid cooler with its two fans running at full speed (around 2300 RPM). Ambient temperatures were held around 23°C (and normalised to 23°C where there were slight fluctuations).
We read the Tdie temperature for Ryzen which accounts for the 20°C temperature offset. The charted temperatures are without the 20°C offset added on. Ryzen idle temperatures are omitted due to inaccurate readings caused by sensor drift. Ryzen 7 1700 temperature data is omitted as the numbers are incorrect (sometimes sub-ambient).
Thermal performance from the 7740X seems to be slightly better than that of the 7700K in general. One of the reasons for this slight improvement, despite both chips using TIM under the heatspreader and not solder, is due to the significantly larger surface area of the LGA 2066 i7-7740X's heatspreader.
With that said, temperatures are still higher than we would like to see for a quad-core CPU and this is due to the use of TIM. At stock clocks, the i7-7740X runs at 54°C in Cinebench which is hotter than a Ryzen 5 1600X, Ryzen 7 1800X, Core i7-6800K, and Core i7-6950X, all of which offer significantly higher performance in that same benchmark and consumer more power.
Throw overclocking into the picture, and the Kaby Lake-X 7740X is practically the joint-second hottest processor that we have tested. Only the 10-core i9-7900X runs significantly warmer when overclocked. That's not a place on the chart where a four-core processor should be sitting, even after its very high operating frequency of 5.1GHz is accounted for. The power being pushed through the quad-core i7 processors simply does not warrant such elevated temperatures.
Clearly there are still thermal barriers that need to be fixed with Intel's heatspreader design before we can consider this as a superb option for overclocking users. De-lidding is an option but not everybody is comfortable with voiding the warranty on a $339 CPU or risking damaging their expensive new chip.
 KitGuru KitGuru.net – Tech News | Hardware News | Hardware Reviews | IOS | Mobile | Gaming | Graphics Cards


Nice review.
A complete fail from Intel
man i might have to drop kitguru review soon. cant we get a simpler comparison at all these at same frequency? and the power consumption chart simply states 7700k or 7740X and respective “OC” as to what that OC is i’d have to flip back and forth between two browser tabs to your test methodology page.
also im going to assume on power consumption page, the first graph is cinebench? cause the 2nd graph has title says cinebench but first one doesnt..?
finally, if you can please add a drop down menu which page to jump not ONLY at the top of the review but also at the bottom of the review. bottom of the review only has pages to jump to from 1 to 10 and have no idea which is which, making it more work having to guess. power users like to be quick and efficient, was hoping this review be the same.
jobsworth.
Hi. We used to put the speed of the CPU in the chart next to its name but this was taking up a large amount of space on the chart and compressing the data area, making the results more difficult to read. Thanks for the feedback, though, as it shows that there is still adjustment to do for readability improvements on the charts.
Yes, the first chart shows Idle, Cinebench Load, and AIDA 64 stress test power numbers. These are all listed in the key in the bottom-left corner of the chart. That’s normal for charts showing more than one piece of data where the information pertaining to the tests run would not make sense (or fit) in the title.
I much prefer the less cluttered views for the record. But I’ve got a good memory for numbers.