The market for people buying an expensive CPU and using it for gaming at 1080p is likely to be very slim. What 1080p does is give a good indication of the CPU's raw gaming performance as GPU power is sufficient to push frame rates to a level where the CPU and memory limitations can be observed.
We supplement the 1080p gaming results with a pair of games tested at 1440P and 4K. We chose Ghost Recon Wildlands and GTA V as they are computationally-heavy, open-world games with good built-in benchmarks.
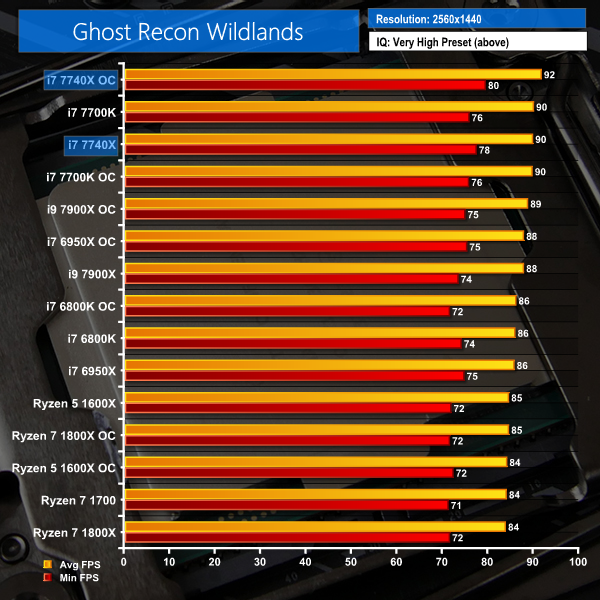
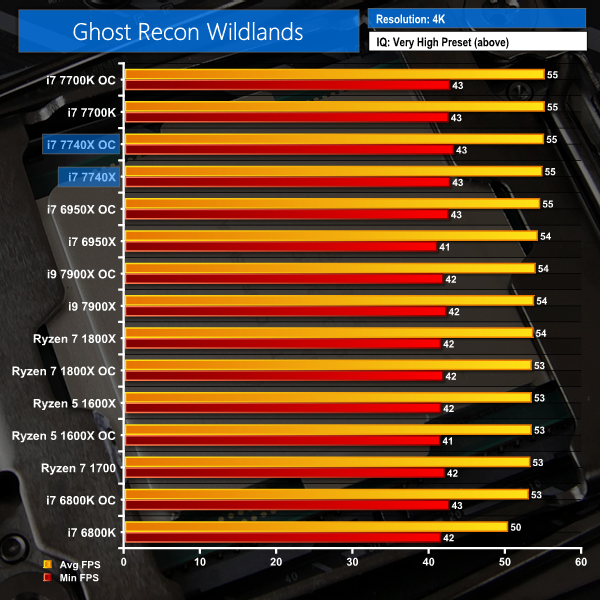
Ghost Recon Wildlands
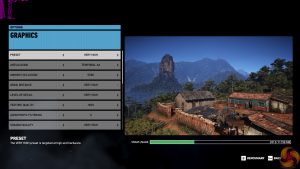
We run the built-in benchmark using a 1440P and 4K resolution and the same settings as the 1080p test (Very High preset).
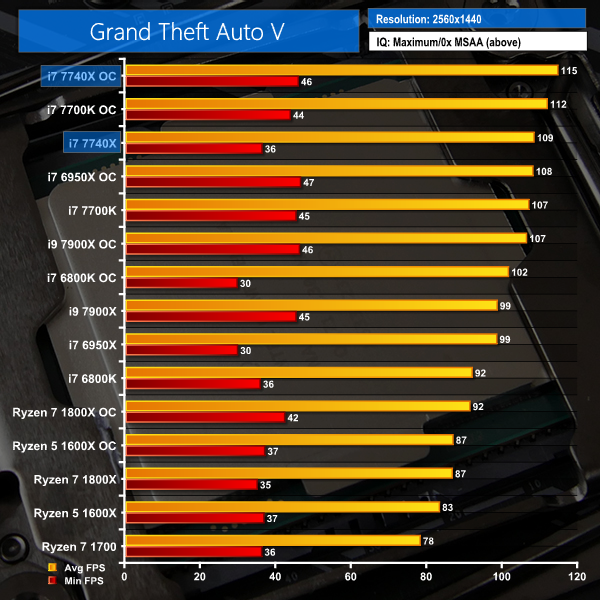
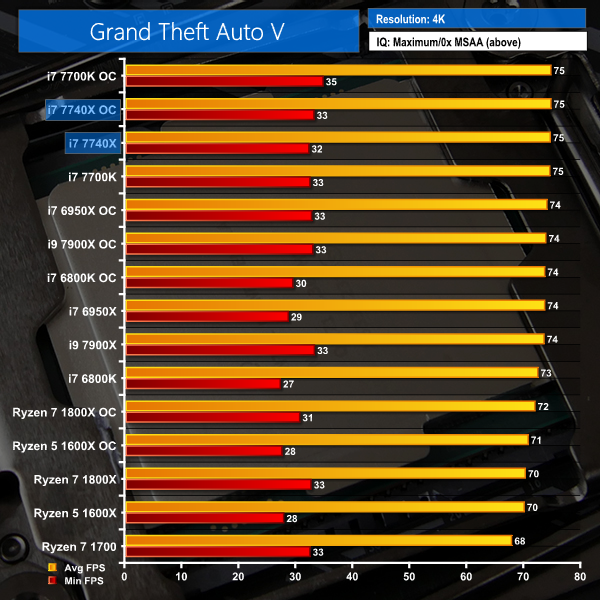
Grand Theft Auto V
We run the built-in benchmark using a 1440P and 4K resolution and the same settings as the 1080p test (generally Maximum quality settings including Advanced Graphics).
1440P and 4K Gaming Performance Overview:
Even with the resolutions increased, the Kaby Lake and Kaby Lake-X Core i7 CPUs maintain their positions atop the charts. If you are a high-resolution gamer, the Core i7-7740X is a good CPU for your system. However, it does not offer a noticeable performance advantage over the i7-7700K and its cheaper LGA 1151 platform.
4K60 gamers are spoilt with choice when it comes to purchasing a CPU. There's little performance difference between all of the chips on display at this resolution where GPU horsepower is in high demand. Kaby Lake-X is up there amongst the fastest options at 4K but it isn't necessarily the best choice if you also want to stream gameplay at the same time.
 KitGuru KitGuru.net – Tech News | Hardware News | Hardware Reviews | IOS | Mobile | Gaming | Graphics Cards





Nice review.
A complete fail from Intel
man i might have to drop kitguru review soon. cant we get a simpler comparison at all these at same frequency? and the power consumption chart simply states 7700k or 7740X and respective “OC” as to what that OC is i’d have to flip back and forth between two browser tabs to your test methodology page.
also im going to assume on power consumption page, the first graph is cinebench? cause the 2nd graph has title says cinebench but first one doesnt..?
finally, if you can please add a drop down menu which page to jump not ONLY at the top of the review but also at the bottom of the review. bottom of the review only has pages to jump to from 1 to 10 and have no idea which is which, making it more work having to guess. power users like to be quick and efficient, was hoping this review be the same.
jobsworth.
Hi. We used to put the speed of the CPU in the chart next to its name but this was taking up a large amount of space on the chart and compressing the data area, making the results more difficult to read. Thanks for the feedback, though, as it shows that there is still adjustment to do for readability improvements on the charts.
Yes, the first chart shows Idle, Cinebench Load, and AIDA 64 stress test power numbers. These are all listed in the key in the bottom-left corner of the chart. That’s normal for charts showing more than one piece of data where the information pertaining to the tests run would not make sense (or fit) in the title.
I much prefer the less cluttered views for the record. But I’ve got a good memory for numbers.