3DMark
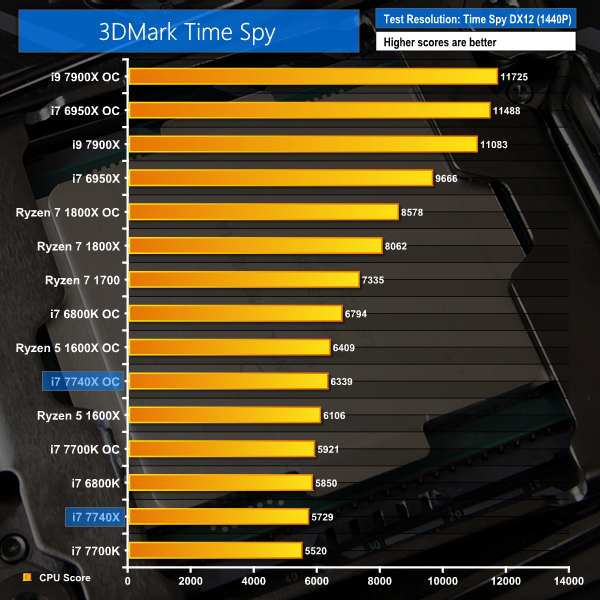
3DMark is a multi-platform hardware benchmark designed to test varying resolutions and detail levels of 3D gaming performance. We run the Windows platform test and in particular the Fire Strike benchmark, which is indicative of high-end 1080p PC Gaming. We also test using the Time Spy benchmark which gives an indication of DirectX 12 performance.
Grand Theft Auto V
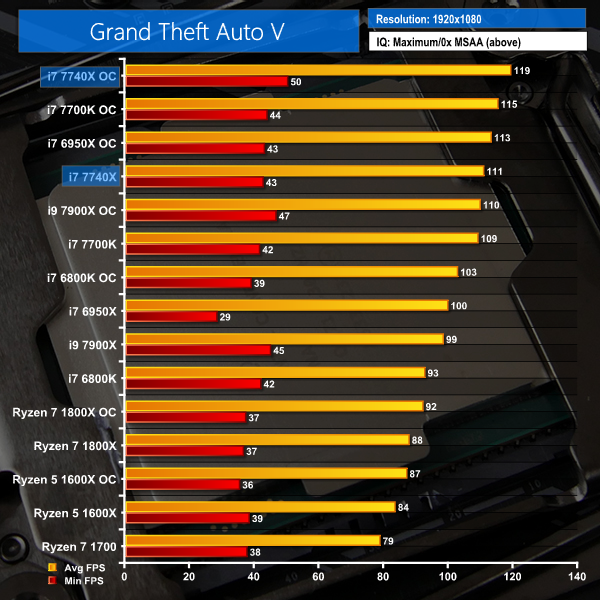
Grand Theft Auto V remains an immensely popular game for PC gamers and as such retains its place in our test suite. The well-designed game engine is capable of providing heavy stress to a number of system components, including the GPU, CPU, and Memory, and can highlight performance differences between motherboards.
We run the built-in benchmark using a 1080p resolution and generally Maximum quality settings (including Advanced Graphics).
Metro: Last Light Redux
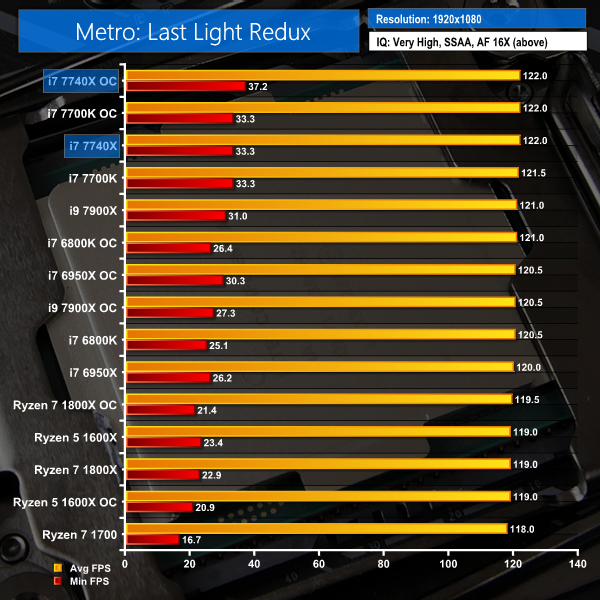
Despite its age, Metro: Last Light Redux remains a punishing title for modern computer hardware. We use the game's built-in benchmark with quality set to Very High, SSAA enabled, AF 16X, and High tessellation.
Gaming Performance Overview:
Gaming performance is where the Core i7-7740X sets the playing field alight, just as its mainstream 7700K cousin did. Kaby Lake with high clock speeds is the recipe for chart-topping gaming performance numbers.
3DMark is well multi-threaded and therefore does not reward the 7740X's significant clock speed. GTA V and Metro: Last Light, both of which like clock frequency and, especially in GTA's case, core count, show superb performance with the Kaby Lake-X Core i7. Overclocking to 5.1GHz firmly positions the 7740X at the top of both gaming charts, with the next closest competitor being our lower-clocked 7700K.
Compared to the Ryzen 7 offerings, the Core i7-7740X destroys all of AMD's options when it comes to performance in GTA V (which is known to favour Intel hardware) in a way that will be important to high refresh rate gamers. Of course, the trade-off is a severely diminished amount of spare CPU resources for operations such as streaming whilst gaming, if that is important to you.
 KitGuru KitGuru.net – Tech News | Hardware News | Hardware Reviews | IOS | Mobile | Gaming | Graphics Cards


Nice review.
A complete fail from Intel
man i might have to drop kitguru review soon. cant we get a simpler comparison at all these at same frequency? and the power consumption chart simply states 7700k or 7740X and respective “OC” as to what that OC is i’d have to flip back and forth between two browser tabs to your test methodology page.
also im going to assume on power consumption page, the first graph is cinebench? cause the 2nd graph has title says cinebench but first one doesnt..?
finally, if you can please add a drop down menu which page to jump not ONLY at the top of the review but also at the bottom of the review. bottom of the review only has pages to jump to from 1 to 10 and have no idea which is which, making it more work having to guess. power users like to be quick and efficient, was hoping this review be the same.
jobsworth.
Hi. We used to put the speed of the CPU in the chart next to its name but this was taking up a large amount of space on the chart and compressing the data area, making the results more difficult to read. Thanks for the feedback, though, as it shows that there is still adjustment to do for readability improvements on the charts.
Yes, the first chart shows Idle, Cinebench Load, and AIDA 64 stress test power numbers. These are all listed in the key in the bottom-left corner of the chart. That’s normal for charts showing more than one piece of data where the information pertaining to the tests run would not make sense (or fit) in the title.
I much prefer the less cluttered views for the record. But I’ve got a good memory for numbers.