7-Zip
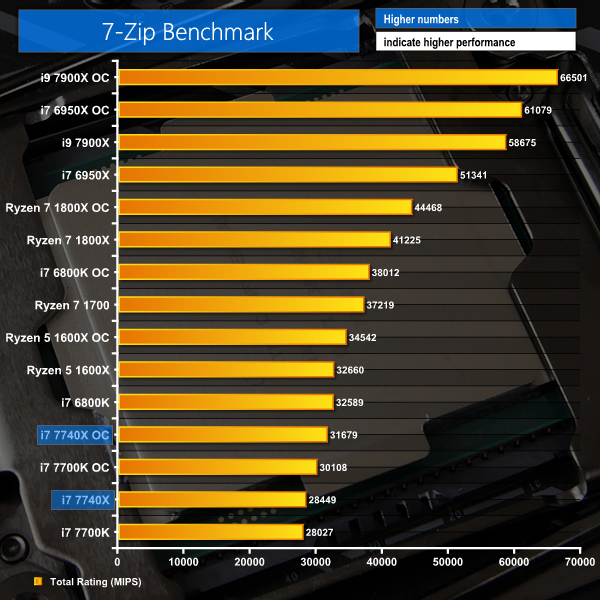
7-Zip is an open source Windows utility for manipulating archives. We measure the Total Rating performance using the built-in benchmark tool. The test stresses all CPU cores to 100% and shows an affinity for memory bandwidth.
Mozilla Kraken
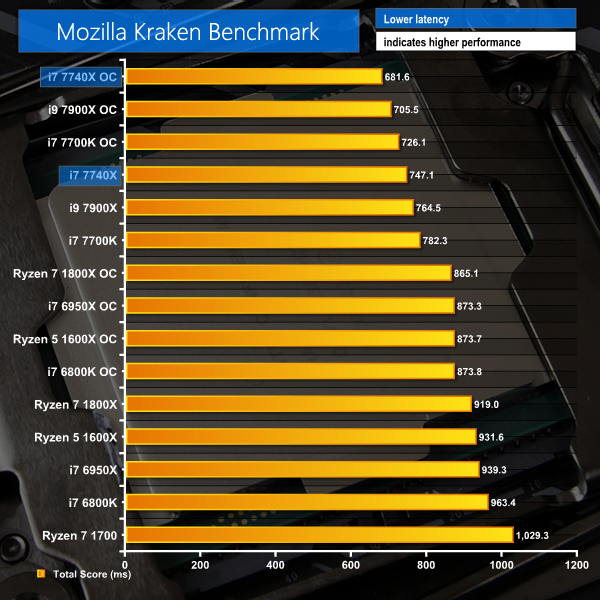
Mozilla Kraken is a browser-based JavaScript benchmark that tests a variety of real-world use cases. We use Chrome as the test browser. The test exhibits very little multi-threading and shows an affinity for CPU clock speed and IPC.
Sandra Memory Bandwidth
Overview:
7-Zip is well multi-threaded and therefore the Ryzen 7 1700 hands the stock-clocked i7-7740X a strong beating in that test, outperforming Intel's chip by 31%. Intel, however, has the advantage when it comes to Mozilla Kraken performance thanks to the fast operating frequency and well-built microarchitecture being far more important than core count.
Compared to the Core i7-7700K, Intel's new Kaby Lake-X chip is marginally faster thanks to its 100MHz frequency advantage. Turning on the afterburners and overclocking the 7740X to 5.1GHz, however, yields strong results in the 7-Zip benchmark and chart-topping performance Mozilla Kraken.
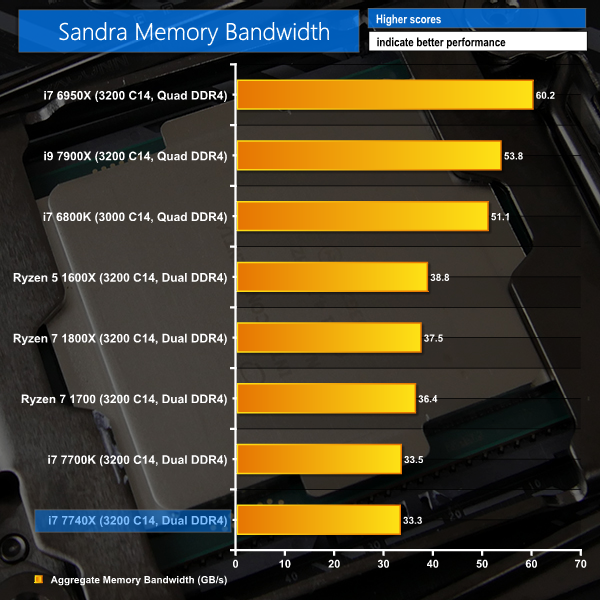
Intel's dual-channel Core i7s trail Ryzen in terms of memory bandwidth. An even greater performance deficit is shown against the quad-channel Intel HEDT processors. Kaby Lake-X is not the best choice if memory bandwidth is important. However, an AIDA64 latency score of 42.9ns, versus 73.5ns for the Ryzen 7 1700, shows where the dual-channel Core i7s perform well.
 KitGuru KitGuru.net – Tech News | Hardware News | Hardware Reviews | IOS | Mobile | Gaming | Graphics Cards


Nice review.
A complete fail from Intel
man i might have to drop kitguru review soon. cant we get a simpler comparison at all these at same frequency? and the power consumption chart simply states 7700k or 7740X and respective “OC” as to what that OC is i’d have to flip back and forth between two browser tabs to your test methodology page.
also im going to assume on power consumption page, the first graph is cinebench? cause the 2nd graph has title says cinebench but first one doesnt..?
finally, if you can please add a drop down menu which page to jump not ONLY at the top of the review but also at the bottom of the review. bottom of the review only has pages to jump to from 1 to 10 and have no idea which is which, making it more work having to guess. power users like to be quick and efficient, was hoping this review be the same.
jobsworth.
Hi. We used to put the speed of the CPU in the chart next to its name but this was taking up a large amount of space on the chart and compressing the data area, making the results more difficult to read. Thanks for the feedback, though, as it shows that there is still adjustment to do for readability improvements on the charts.
Yes, the first chart shows Idle, Cinebench Load, and AIDA 64 stress test power numbers. These are all listed in the key in the bottom-left corner of the chart. That’s normal for charts showing more than one piece of data where the information pertaining to the tests run would not make sense (or fit) in the title.
I much prefer the less cluttered views for the record. But I’ve got a good memory for numbers.