Cinebench
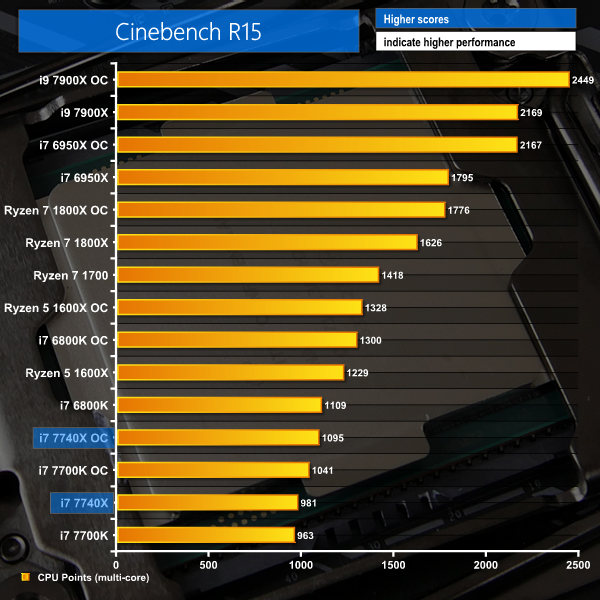
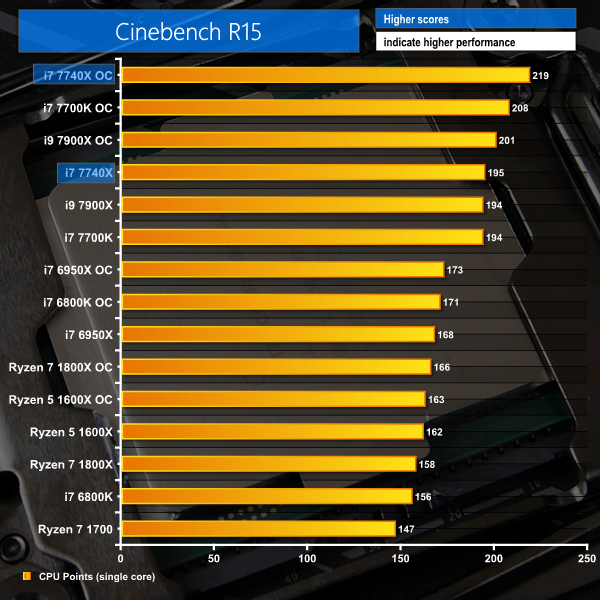
Cinebench is an application which renders a photorealistic 3D scene to benchmark a computer’s rendering performance, on one CPU core, all CPU cores or using the GPU. We run the test using the all-core CPU and single-thread CPU modes.
Handbrake Conversion
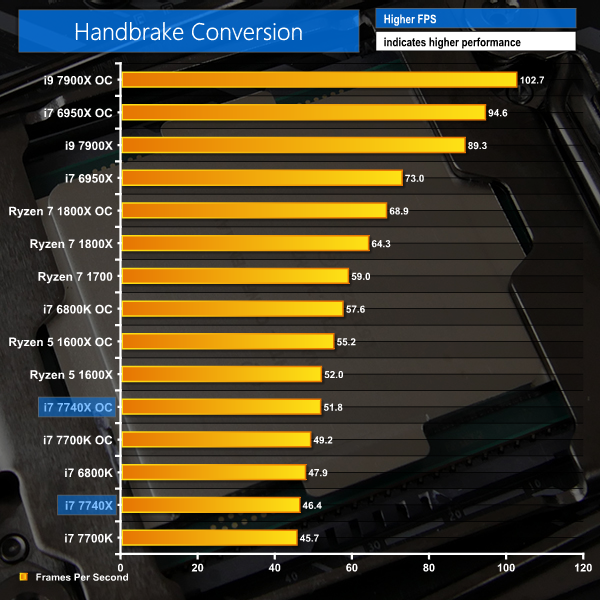
Handbrake is a free and open-source video transcoding tool that can be used to convert video files between different codecs, formats and resolutions. We measured the average frame rate achieved for a task of converting a 6.27GB 4K video using the Normal Profile setting and MP4 container. The test stresses all CPU cores to 100% and shows an affinity for memory bandwidth.
x265 Encoding
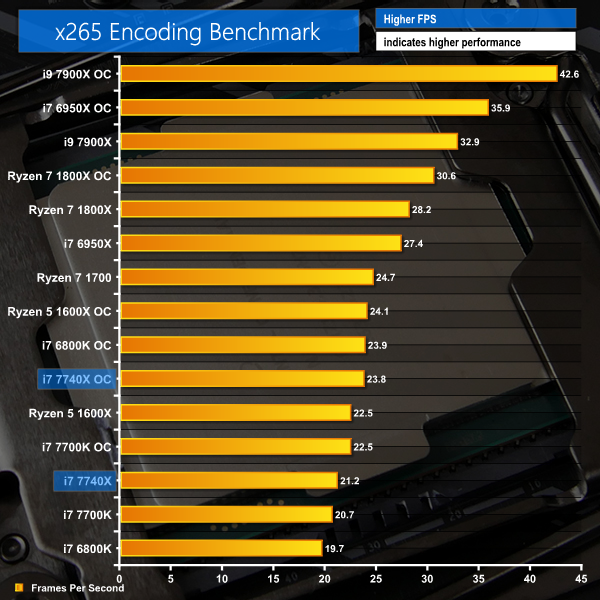
x265 Encoding tests system performance by encoding a 1080p test file using the x265/HEVC format.
Overview:
The Core i7-7740X's performance in our CPU-heavy, multi-threaded benchmarks is unsurprising. A slight frequency bump over the 4C8T 7700K allows the 7740X to offer slight performance improvements in all circumstances (1.9% in Cinebench, 1.5% in Handbrake, and 2.4% in x265 encoding). However, compared to the similarly-priced Ryzen 7 1700, Intel's quad-core processor is well-and-truly beaten when focussing on multi-threaded performance.
Single-core performance is a clear strength for the 7740X thanks to its Skylake-based microarchitecture and very high operating frequencies. When overclocked to 5.1GHz, the quad-core Kaby Lake-X i7 establishes a very comfortable lead in the Cinebench single-threaded test.
Looking at comparative performance, the Ryzen 7 1700 is 45% faster than the stock-clocked 7740X in Cinebench, 27% quicker in Handbrake, and 17% better in x265 encoding. However, the stock 7740X is 33% higher performance than the Ryzen 7 1700 in Cinebench single-threaded. The Kaby Lake-X i7 puts up a better fight against the six-core Broadwell-E i7-6800K thanks to the latter's significant frequency disadvantage.
 KitGuru KitGuru.net – Tech News | Hardware News | Hardware Reviews | IOS | Mobile | Gaming | Graphics Cards


Nice review.
A complete fail from Intel
man i might have to drop kitguru review soon. cant we get a simpler comparison at all these at same frequency? and the power consumption chart simply states 7700k or 7740X and respective “OC” as to what that OC is i’d have to flip back and forth between two browser tabs to your test methodology page.
also im going to assume on power consumption page, the first graph is cinebench? cause the 2nd graph has title says cinebench but first one doesnt..?
finally, if you can please add a drop down menu which page to jump not ONLY at the top of the review but also at the bottom of the review. bottom of the review only has pages to jump to from 1 to 10 and have no idea which is which, making it more work having to guess. power users like to be quick and efficient, was hoping this review be the same.
jobsworth.
Hi. We used to put the speed of the CPU in the chart next to its name but this was taking up a large amount of space on the chart and compressing the data area, making the results more difficult to read. Thanks for the feedback, though, as it shows that there is still adjustment to do for readability improvements on the charts.
Yes, the first chart shows Idle, Cinebench Load, and AIDA 64 stress test power numbers. These are all listed in the key in the bottom-left corner of the chart. That’s normal for charts showing more than one piece of data where the information pertaining to the tests run would not make sense (or fit) in the title.
I much prefer the less cluttered views for the record. But I’ve got a good memory for numbers.