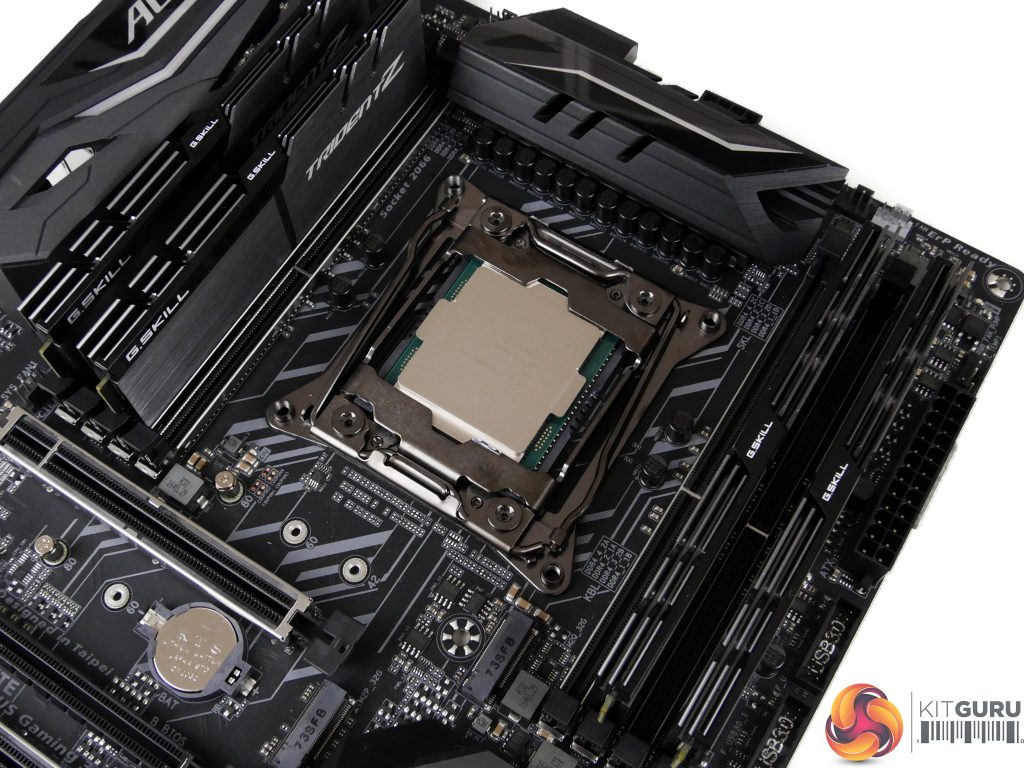
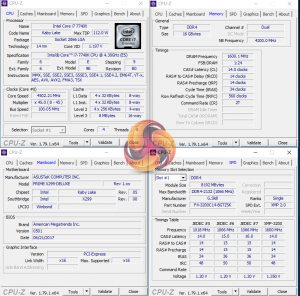
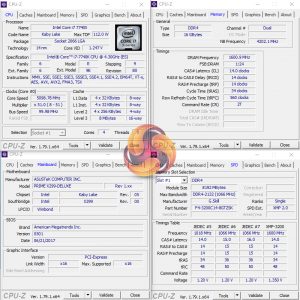
We will be outlining the Core i7-7740X CPU's performance while using an ASUS X299-Deluxe LGA 2066 motherboard. A 16GB (2x8GB) kit of G.Skill's 3200MHz CL14 DDR4 memory serves our test system.
Today's comparison processors come in the form of:
- Broadwell-E i7-6800K (6C12T) and i7-6950X (10C20T).
- Kaby Lake's i7-7700K (4C8T).
- Ryzen 7's 1700 (8C16T) and 1800X (8C16T).
- Ryzen 5's 1600X (6C12T).
- Skylake-X i9-7900X (10C20T).
Each processor is tested at its default out-of-the-box settings and when overclocked to a reasonable level. For the Intel CPUs, we ensured that forced-turbo was disabled so that Intel's defined Turbo Boost parameters were functioning correctly. As such, all-core load frequencies for the tested chips are as follows:
- Core i7-7740X = 4.5GHz.
- Core i9-7900X = 4.0GHz (most of the time, with Handbrake or synthetic stress tests as an exception).
- Core i7-6950X = 3.4GHz (most of the time, with Handbrake or synthetic stress tests as an exception).
- Core i7-6800K = 3.5GHz.
- Core i7-7700K = 4.4GHz.
- Ryzen 7 1800X = 3.7GHz.
- Ryzen 7 1700 = 3.2GHz.
- Ryzen 5 1600X = 3.7GHz.
CPU Test System Common Components:
- Graphics Card: Nvidia GeForce GTX 1080 Ti Founders Edition (custom fan curve to eliminate thermal throttling).
- CPU Cooler: Noctua NH-D15 & Corsair H110i GT.
- Games SSD: SK hynix SE3010 SATA 6Gbps 960GB.
- Power Supply: Seasonic Platinum 760W.
- Operating System: Windows 10 Pro 64-bit (Creators Edition).
Skylake-X LGA 2066 System (i7-7740X, i9-7900X):
- 7740X CPU: Intel Core i7 7740X ‘Kaby Lake-X' (ES) 4 cores, 8 threads (5.1GHz @ 1.30V overclocked).
- 7900X CPU: Intel Core i9 7900X ‘Skylake-X' (ES) 10 cores, 20 threads (4.6GHz @ 1.20V overclocked).
- Motherboard: ASUS X299-Deluxe (LGA 2066, X299).
- Memory: 16GB (2x8GB) or 32GB (4x8GB) G.Skill Trident Z 3200MHz 14-14-14-34 DDR4 @ 1.35V.
- System Drive: Samsung 840 500GB.
Ryzen AM4 System (Ryzen 5 1600X, Ryzen 7 1700, Ryzen 7 1800X):
- 1800X CPU: AMD Ryzen 7 1800X ‘Summit Ridge' 8 cores, 16 threads (4.05GHz @ 1.425V overclocked).
- 1700 CPU: AMD Ryzen 7 1700 ‘Summit Ridge' 8 cores, 16 threads.
- 1600X CPU: AMD Ryzen 5 1600X ‘Summit Ridge' 6 cores, 12 threads (4.0GHz @ 1.4125V overclocked).
- Motherboard: Gigabyte Aorus AX370-Gaming 5 & ASUS Crosshair VI Hero (AM4, X370, AGESA 1006).
- Memory: 16GB (2x8GB) G.Skill FlareX 3200MHz 14-14-14-34 DDR4 @ 1.35V.
- System Drive: SanDisk Ultra Plus 256GB.
Kaby Lake LGA 1151 System (i7-7700K):
- 7700K CPU: Intel Core i7-7700K ‘Kaby Lake' (Retail) 4 cores, 8 threads (4.8GHz @ 1.35V overclocked).
- Motherboard: ASUS Maximus VIII Hero (LGA 1151, Z170).
- Memory: 16GB (2x8GB) G.Skill FlareX 3200MHz 14-14-14-34 DDR4 @ 1.35V.
- System Drive: Micron M600 256GB.
Broadwell-E LGA 2011-3 System (i7-6800K, i7-6950X):
- 6800K CPU: Intel Core i7 6800K ‘Broadwell-E' (Retail) 6 cores, 12 threads (4.2GHz @ 1.275V overclocked).
- 6950X CPU: Intel Core i7 6950X ‘Broadwell-E' (Retail) 10 cores, 20 threads (4.2GHz @ 1.275V overclocked).
- Motherboard: ASUS ROG Strix X99 Gaming (LGA 2011-v3, X99).
- Memory: 32GB (4x8GB) G.Skill Trident Z 3200MHz 14-14-14-34 DDR4 @ 1.35V (at 3000MHz for the 6800K due to IMC weakness).
- System Drive: Kingston HyperX 3K 120GB.
Software:
- ASUS X299-Deluxe BIOS v0501 (pre-release).
- GeForce 382.33 VGA drivers.
Tests:
Productivity-related:
- Cinebench R15 – All-core & single-core CPU benchmark (CPU)
- HandBrake – Convert 6.27GB 4K video recording using the Normal Profile setting and MP4 container (CPU)
- Mozilla Kraken – Browser-based JavaScript benchmark (CPU)
- x265 Benchmark – 1080p H.265/HEVC encoding benchmark (CPU)
- 7-Zip – Built-in 7-Zip benchmark test (CPU & Memory)
- SiSoft Sandra – Memory bandwidth (Memory)
Gaming-related:
- 3DMark Time Spy – Time Spy (DX12) test (Gaming)
- Ashes of the Singularity Escalation – Built-in benchmark tool CPU-Focused test, 1920 x 1080, Extreme quality preset, DX12 version (Gaming)
- Ghost Recon: Wildlands – Built-in benchmark tool, 1920 x 1080, Very High quality preset, DX12 (Gaming)
- Grand Theft Auto V – Built-in benchmark tool, 1920 x 1080, Maximum quality settings, Maximum Advanced Graphics, DX11 (Gaming)
- Metro: Last Light Redux – Built-in benchmark tool, 1920 x 1080, Very High quality settings, SSAA Enabled, AF 16X, High Tessellation, DX11 (Gaming)
- Total War Warhammer – Built-in benchmark tool, 1920 x 1080, Ultra quality preset, DX12 version (Gaming)
 KitGuru KitGuru.net – Tech News | Hardware News | Hardware Reviews | IOS | Mobile | Gaming | Graphics Cards


Nice review.
A complete fail from Intel
man i might have to drop kitguru review soon. cant we get a simpler comparison at all these at same frequency? and the power consumption chart simply states 7700k or 7740X and respective “OC” as to what that OC is i’d have to flip back and forth between two browser tabs to your test methodology page.
also im going to assume on power consumption page, the first graph is cinebench? cause the 2nd graph has title says cinebench but first one doesnt..?
finally, if you can please add a drop down menu which page to jump not ONLY at the top of the review but also at the bottom of the review. bottom of the review only has pages to jump to from 1 to 10 and have no idea which is which, making it more work having to guess. power users like to be quick and efficient, was hoping this review be the same.
jobsworth.
Hi. We used to put the speed of the CPU in the chart next to its name but this was taking up a large amount of space on the chart and compressing the data area, making the results more difficult to read. Thanks for the feedback, though, as it shows that there is still adjustment to do for readability improvements on the charts.
Yes, the first chart shows Idle, Cinebench Load, and AIDA 64 stress test power numbers. These are all listed in the key in the bottom-left corner of the chart. That’s normal for charts showing more than one piece of data where the information pertaining to the tests run would not make sense (or fit) in the title.
I much prefer the less cluttered views for the record. But I’ve got a good memory for numbers.