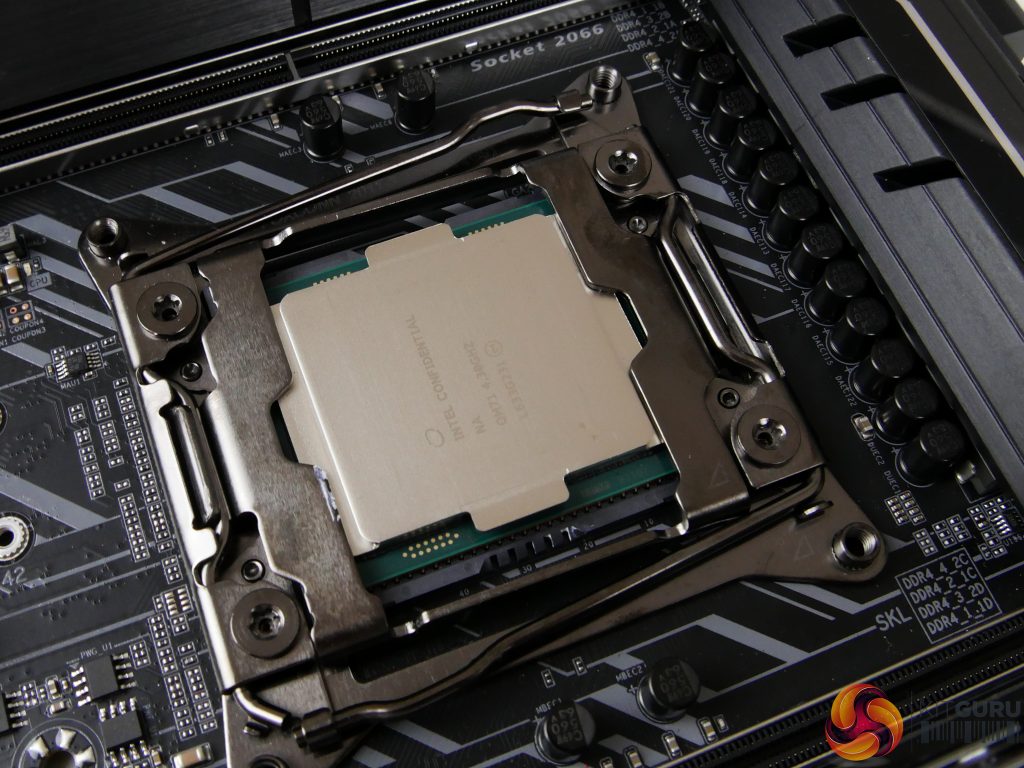
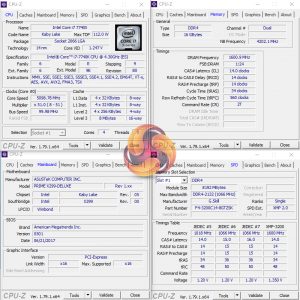
Our objective with CPU overclocking is to hit frequencies that we think will be achievable for daily use by the platform’s buyers. As such, we test with sensible cooling hardware in the Corsair H110i GT 280mm AIO. We also used sensible voltages that lead to manageable thermal results.
Stability is confirmed by running multiple Cinebench tests, Handbrake video conversion, and AIDA64 CPU, FPU, and Cache stress test for at least 1 hour. We do not use Prime95 as we have found it to be overly demanding as a stress test application with the more recent AVX-capable versions.
The partnering hardware of choice is the ASUS X299-Deluxe motherboard, 16GB of G.SKILL TridentZ 3200MHz CL14 DDR4, and a Seasonic 760W Platinum PSU. We chose the ASUS motherboard due to its strong power delivery system based around International Rectifiers MOSFETs.
That added 4-pin power connector gives extra peace of mind when overclocking the very power-hungry Skylake-X CPUs but is not really necessary for Kaby Lake-X overclocking (outside of LN2 extreme OC). We also point a 100mm Antec Spot Cool at the VRM heatsink to provide direct airflow for cooling.
Overclocking with the Kaby Lake-X Core i7-7740X is very rewarding. We were able to hit 5.0GHz very easily with minimal adjustment to the system – we simply applied 1.25V VCore in the UEFI and opted for the Level 3 LLC setting.
Jumping up to 5.1GHz saw us needing 1.30V in the UEFI for stability. We also opted to change the LLC mode to Level 1 but we were unable to validate actual load voltages due to current software reading errors and the ASUS board’s lack of voltage check points. The system was stable with these settings and temperatures were in check using the Corsair H110i GT 280mm AIO cooler.
In short, our final Core i7-7740X overclocking settings using an ASUS X299-Deluxe motherboard were:
- 5.1GHz on all cores.
- 1.30V CPU VCore (in the UEFI).
- Level 1 LLC (around 1.24V AIDA 64 load VCore in OS, according to software readings).
- Multiple Cinebench R15 multi-core runs to validate stability, as well as AIDA64 CPU stress test.
- DDR4-3200MHz 14-14-14-34 @ 1.35V.
Overclocking comments:
Our overclocking results with the Core i7-7740X were positive, hitting 5.1GHz on all cores while maintaining sensible temperature levels. If you are happy pushing the voltage further, it is likely that 5.2GHz will be achievable, provided you can cool the chip.
The overclocking performance looks to be around 100-400MHz better than that of a Core i7-7700K in general. Our specific Core i7-7700K is perfectly stable at a conservative 4.8GHz with 1.31-1.35V and we have seen many 7700K users push their chips to 4.9GHz and 5.0GHz with appropriate cooling.
Core i7-7740X delivers in terms of overclocking results and is likely to be even more overclockable if you decide to delid the chip and replace its TIM with a higher-quality solution.
 KitGuru KitGuru.net – Tech News | Hardware News | Hardware Reviews | IOS | Mobile | Gaming | Graphics Cards


Nice review.
A complete fail from Intel
man i might have to drop kitguru review soon. cant we get a simpler comparison at all these at same frequency? and the power consumption chart simply states 7700k or 7740X and respective “OC” as to what that OC is i’d have to flip back and forth between two browser tabs to your test methodology page.
also im going to assume on power consumption page, the first graph is cinebench? cause the 2nd graph has title says cinebench but first one doesnt..?
finally, if you can please add a drop down menu which page to jump not ONLY at the top of the review but also at the bottom of the review. bottom of the review only has pages to jump to from 1 to 10 and have no idea which is which, making it more work having to guess. power users like to be quick and efficient, was hoping this review be the same.
jobsworth.
Hi. We used to put the speed of the CPU in the chart next to its name but this was taking up a large amount of space on the chart and compressing the data area, making the results more difficult to read. Thanks for the feedback, though, as it shows that there is still adjustment to do for readability improvements on the charts.
Yes, the first chart shows Idle, Cinebench Load, and AIDA 64 stress test power numbers. These are all listed in the key in the bottom-left corner of the chart. That’s normal for charts showing more than one piece of data where the information pertaining to the tests run would not make sense (or fit) in the title.
I much prefer the less cluttered views for the record. But I’ve got a good memory for numbers.