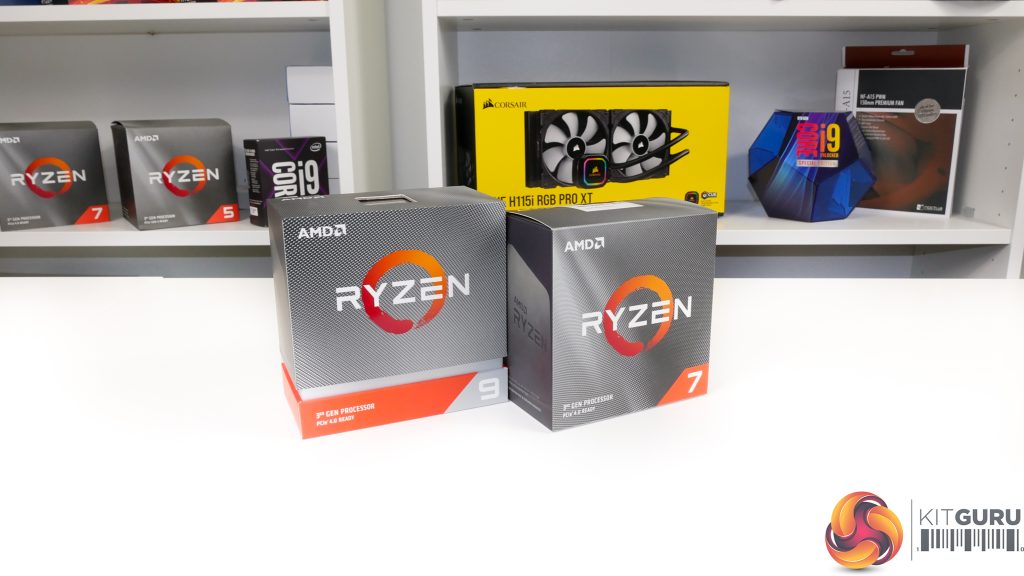
We will be outlining the AMD Ryzen 7 3800XT and Ryzen 9 3900XT CPUs' performance while using the ASUS ROG STRIX X570-E Gaming motherboard and with additional test data and validation from the MSI B550 Tomahawk. A 32GB (2x16GB) kit of 3600MHz CL16 DDR4 memory serves our test system.
Today's comparison processors come in the form of:
- Comet Lake Core i7-10700K (8C16T) and Core i9-10900K (10C20T).
- Matisse ‘Zen 2' Ryzen 7 3700X (8C16T), Ryzen 7 3800X (8C16T), Ryzen 9 3900X (12C24T), and Ryzen 9 3950X (16C32T).
Each processor is tested at its default out-of-the-box settings. For the Intel CPUs, unlimited turbo duration as set by the motherboard with XMP enabled is the operating mode. All-core load frequencies for the tested chips are as follows:
- Core i7-10700K = 4.7GHz.
- Core i9-10900K = 4.9GHz.
- Ryzen 7 3700X = around 4.05GHz.
- Ryzen 7 3800X = around 4.125GHz.
- Ryzen 9 3900X = around 4.05GHz.
- Ryzen 9 3950X = around 3.875GHz.
- Ryzen 7 3800XT = around 4.225GHz.
- Ryzen 9 3900XT = around 4.05GHz.
CPU Test System Components:
- Graphics Card: Gigabyte Aorus RTX 2080 Ti XTREME (custom fan curve to minimise thermal throttling).
- Memory: 32GB (2x16GB) Corsair Vengeance LPX 3600MHz 16-18-18-36 DDR4 @ 1.35V.
- CPU Cooler: Fractal Celsius+ S28 Prisma 280mm AIO at full pump and fan speed
- OS SSD: WD_Black SN750 NVMe SSD.
- Games SSD: Aorus 2TB PCIe Gen 4 M.2 SSD.
- Power Supply: Seasonic Prime TX-1000.
- Chassis: Lian Li T60 Open Air Test Bench.
- Operating System: Windows 10 Pro 64-bit.
- AM4 Motherboards: ASUS ROG STRIX X570-E Gaming & MSI B550 Tomahawk.
- Z490 Motherboard: MSI MEG Z490 ACE.
Tests:
Productivity-related:
- Cinebench R20 – All-core & single-core CPU benchmark (CPU)
- Blender 2.82a – All-core rendering of the Classroom benchmark (CPU)
- HandBrake H264 – Convert 1440p60 H264 video to 1080p60 H264 using the YouTube HQ 1080p60 preset (CPU)
- HandBrake H265 – Convert 4K30 100Mbps H264 video to 1080p30 40Mbps H265 using the H.265 MKV 1080p30 preset (CPU & Memory)
- 7-Zip – Built-in 7-Zip benchmark test (CPU & Memory)
- SiSoft Sandra – Memory bandwidth and Cache & Memory Latency Test (Memory)
- AIDA64 – Memory bandwidth & memory latency (Memory)
Gaming-related:
- Red Dead Redemption 2 – 1920×1080 & 2560×1440, High settings manually applied, DX12 (Gaming)
- Shadow of the Tomb Raider – 1920×1080 & 2560 x 1440, Highest quality preset, no AA, DX12 version (Gaming)
- The Division 2 – 1920×1080 & 2560×1440, Ultra quality preset, no AA, DX12 version (Gaming)
 KitGuru KitGuru.net – Tech News | Hardware News | Hardware Reviews | IOS | Mobile | Gaming | Graphics Cards


