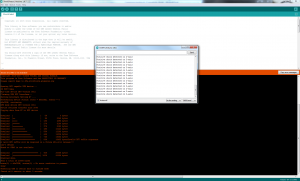
The first bit of code we tried was testing the use of the accelerometer as a motion-detection device. The code basically writes a message back that can be read via the USB port acting as a virtual serial port (which is also how you upload code to the device). If you then jog the Genuino 101, messages will start to appear showing which axis is detecting motion.
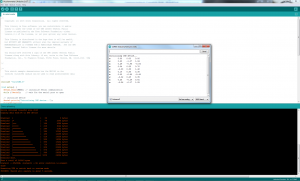
The above code is similar to the motion detection program, except that it shows off the raw G-force data coming from the axes of the accelerometer.
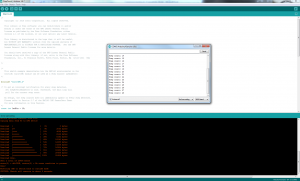
The shock detection has been harnessed in the above code to create a pedometer. Discrete up and down motions are recorded as steps, and the counter goes up for each one.
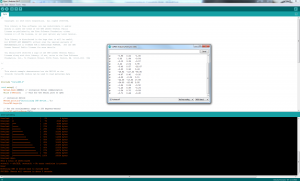
The Genuino 101 can also act as a gyroscope, and this bit of code exposes the raw data showing how the device is oriented.
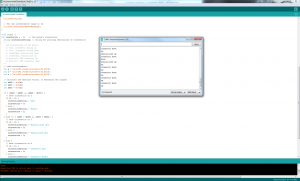
This code takes the raw gyroscope data and uses it to figure out which way up the Genuino 101 is, and then expresses that in words describing this in terms of the layout of the board itself.
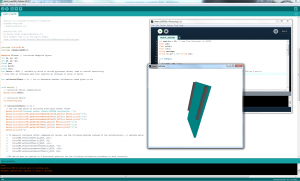
This was the most sophisticated example we tried. Yet again, this relies on the gyroscopic data, but adds another layer of sophistication. Instead of merely exposing the sensor data as a text stream captured from the serial port, the data is fed into a program running in the Processing IDE.
Processing is an environment for drawing graphics in real time, and is popular amongst creative coders for producing funky interactive visuals. There’s an online implementation, too, for creating the same sorts of graphics on Web pages. Here you can see a visual representation of the board, which moves in synchronisation as you move the board. It’s pretty fun to watch, and is the kind of demo that can inspire you with the power that Arduino and the whole open maker movement has to offer.
 KitGuru KitGuru.net – Tech News | Hardware News | Hardware Reviews | IOS | Mobile | Gaming | Graphics Cards


