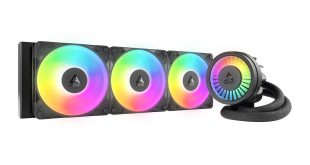
To test all CPU coolers, we devised an easily repeatable test with no variables other than the coolers themselves. This ensures that figures from every cooler we test are comparable with each other.
Test rig
At KitGuru we have recently updated our testing setup, and now test temperatures on the Z170 platform. For the CPU we are testing with the Intel Core i7-7700K installed in an ASUS Z170 Pro Gaming motherboard. For RAM we have a single 8GB stick of Geil EVO X RGB for some added bling running at 3200MHz, and storage is handled by a 120GB SanDisk SSD Plus. Powering our bench is a Seasonic Prime Platinum 650W PSU.
The test process
For testing, we run a number of tests including 4 separate temperature readings per cooler. We first measure the idle temperature of the i7-7700K locked in at 4.0GHz before measuring its temperature under load at the same frequency.
For a representation of overclocks, we run the i7- 7700K at 4.5GHz with a 1.275 Vcore applied both at idle and load. The temperatures we present are temperature deltas, where the ambient temperature of the testing environment is deducted from the temperature taken from the CPU for both idle and load. We are aware that a 4.5GHz overclock with a 1.275 Vcore applied is not representative of the best setting possible for the i7-7700k, but this does allow us to simulate performance of coolers whether you are using a less powerful CPU such as an i3 or i5 processor, or a more powerful hotter CPU like our overclocked i7-7700k.
An idle reading comes from leaving Windows on the desktop for 15 minutes. A load reading comes from running Prime95’s (version 26.6) Small FFTs test for 15 minutes – enough time for temperatures to plateau. We use HWInfo64 v5.82 to measure temperatures.
Noise output
We measure noise levels with our sound meter positioned 1 foot away from the test bench. The peak noise level is presented. We have measured the noise floor (i.e. ambient noise levels of the room) to be 34 dBa, and when tested at stock clocks, the vast majority of coolers do not emit noise levels above this figure. Thus, we present one chart with noise levels taken during our overclocked CPU test run.
 KitGuru KitGuru.net – Tech News | Hardware News | Hardware Reviews | IOS | Mobile | Gaming | Graphics Cards


