It has been a long time since anyone asked, “can it run Crysis?” but there is no doubt that the recommended specifications for high-end Oculus Rift and HTC Vive virtual reality are expensive. An i5-4590 and a R9 290 or GTX 970 are priced at a level that only a small per centage of all Steam users can match, so for many people, VR will mean an upgrade as well as shelling out hundreds on a headset.
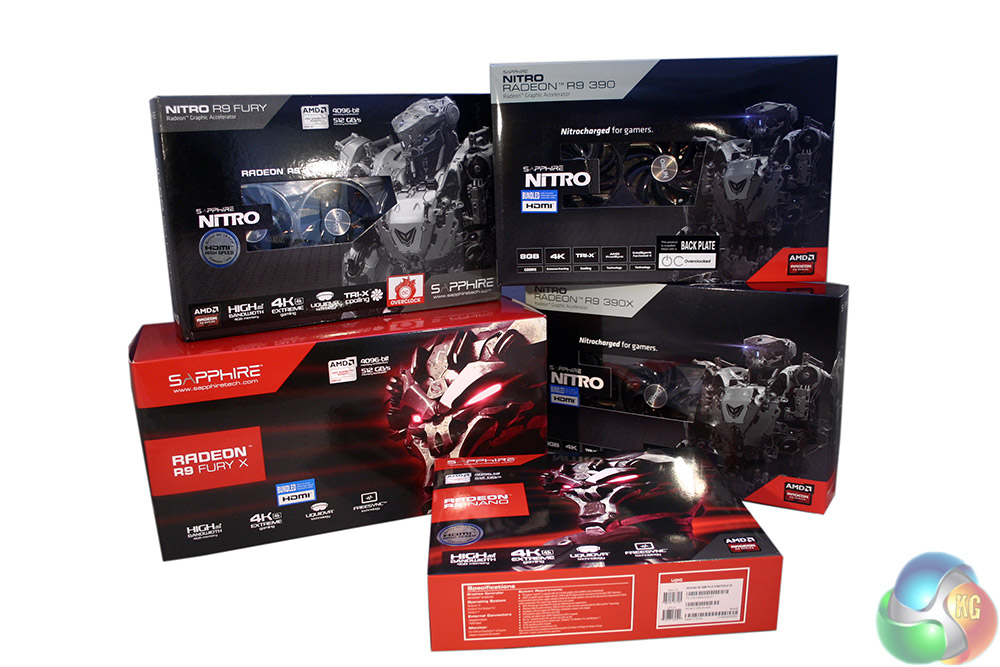
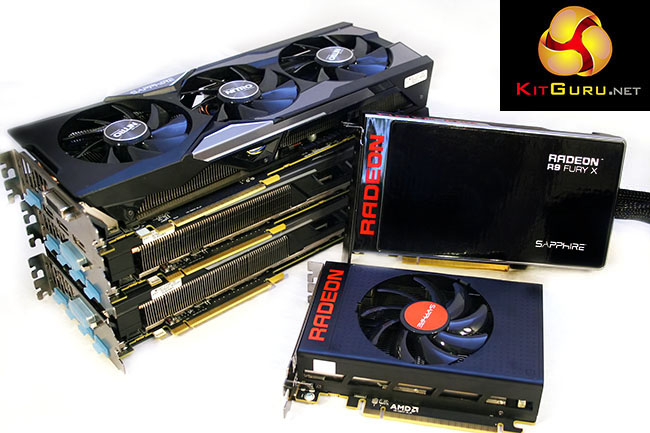
So with that in mind, Sapphire got in touch to offer us the chance to test all their high end graphics solutions. We wanted to see how they stacked up when it comes to displaying dual images of virtual reality right into your eyeballs. They sent us:
- Sapphire R9 FuryX.
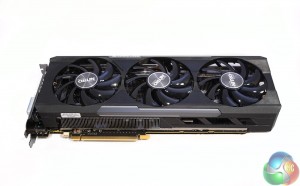
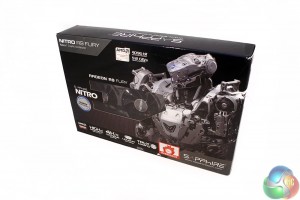
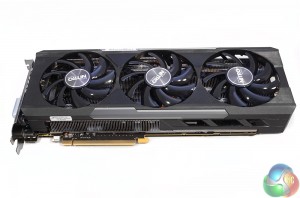
- Sapphire Nitro R9 Fury.
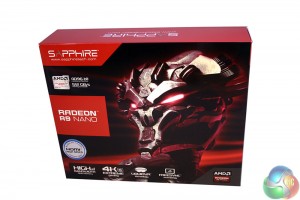
- Sapphire R9 Nano.
- Sapphire Nitro R9 390X.
- Sapphire Nitro R9 390.
To see how these fared, we made use of Valve's VR performance test, which runs a scene from the Aperture Robot Repair demo, as if you were using a VR headset.
The test system we paired these GPUs with was as follows:
- CPU: Intel Core i5 4690k @ 3.5GHz.
- Motherboard: ASUS Z97-K.
- Memory: 16GB G.Skill RipjawsX 2,133MHz RAM.
- Storage: 1TB Kingston SSDNOW v310 SSD.
- PSU: Super Flower SF650 650w (Thanks OCUK).
- OS: Windows 10.
The graphics drivers installed at the time of testing were the AMD 15.12 Crimson, with the 16.3 hotfix applied.
Sapphire Nitro R9 390
Sapphire Nitro R9 390X
Sapphire Nitro R9 Fury
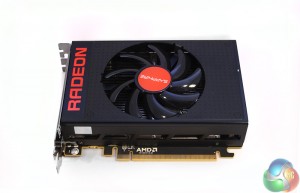
Sapphire R9 Nano
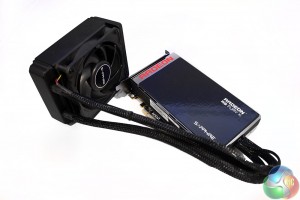
Sapphire R9 Fury X
Methodology
Although we stated that we used Valve's SteamVR Performance Test to find out how each of these GPUs fare under VR conditions, it is worth mentioning that this benchmark works differently than most of the ones we use. Unlike 3DMark or similar, the SteamVR Performance Test uses adaptive quality settings. That means that it consistently changes the quality of the visuals, based on how the graphics card is dealing with the scene.
While that might seem redundant for old benchmark score hunters, there is a very good reason for this in virtual reality: dropping below 90 frames per second is bad news as it can cause a feeling of nausea. A lot of games will employ a similar method of keeping the frame rates high.
That said, the benchmark still puts out a score at the end, based on the level of fidelity maintained throughout the demo and a note to let you know how often the system dropped below 90 frames per second and how often the CPU held things back. There is also a sliding scale of how “VR Ready,” your system is, from not ready, through capable, to “ready” at the green end of the spectrum.
While all of the cards we tested here should have no problem handling the demonstration, they will give us an idea of how VR capable each card is and what sort of detail levels buyers looking to get into early VR adoption can expect.
Standard Results
Fury X, Fury and Nano
390x and 390
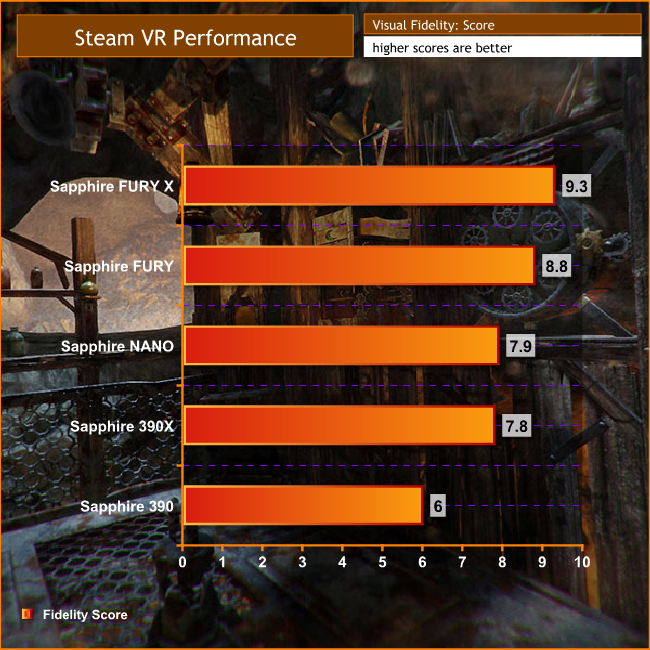
As you would expect, the Fury X walks away with the top marks in this benchmark, while the less powerful, Hawaii Core-based 390x and 390 cards fall a little behind. They all register as VR ready, which is a relief considering the latter cards are based on the same 290 architecture that Oculus and HTC recommend.
There were some instances of sub-90 FPS with the latter card, though they were very few and far between.
Overall, all cards performed well, but what is interesting to note is the difference in overall graphical fidelity. Despite being able to deliver a near-comparable smoothness to the Fury X, all of the other cards forced a drop in graphical fidelity in order to achieve that.
That means that while a R9 390 will get you to a state of being able to play virtual reality games, there is something to be said for running a more powerful graphics card under the hood. Not only will it mean that – like more traditional titles – you will be able to run the experience at a higher visual fidelity, and therefore with a greater sense of realism, but you have more of a buffer against lowered frame rates.
FRAPS data
As much as the above information is useful though, it is not quite as detailed as we would like to see from our benchmarks. It does not give us any indication of how often these cards are capable of outputting more than 90FPS, which in itself can act as a buffer to prevent any visually hefty sections from cannibalising fidelity to maintain that 90FPS baseline.
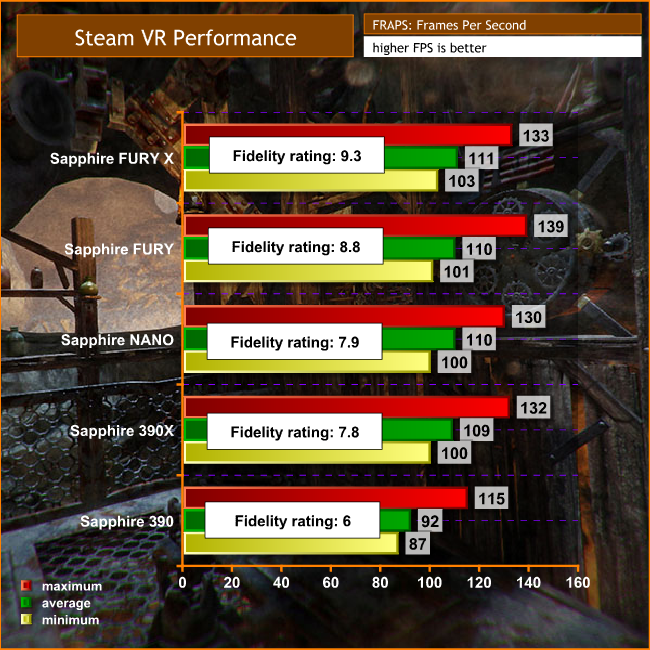
So to help indicate that a bit better, we also ran FRAPS during each benchmark run to get a better insight into how each of the GPUs fared. Plotting out the frame rates into a graph shows us what those fidelity sacrifices made possible in terms of frame rate.
The data from this graph is a little more interesting and further shows what the SteamVR Performance test does in terms of automatically adjusting fidelity to maintain frame rates above 90fps. Although we do see the 390 fall just below that recommended minimum of 90 FPS, all the other cards take it in their stride.
There is some (traditionally) anomalous data in the form of the Fury beating out the Fury X in terms of its maximum FPS and the 390x having comparable performance to the Nano, but these instances can be put down to automatic adjustments in fidelity. Because the 390x and Fury are operating at lower graphical quality than the more powerful cards, they are able to achieve similar frame rates.
This wouldn't be something you would see in a traditional benchmark, but in this one further emphasises that frame rate is more important than visuals in VR.
Closing Thoughts
The big take home from this testing session should be that all of the cards we looked at were capable of delivering solid VR performance, albeit at slightly different visual fidelities.
Although we did not achieve any really useful benchmarking data, we also tested each graphics card with a variety of games, including Windlands, Hover Junkers and Space Pirate Trainer. Each was able to play the games very comfortably, with very few instances of them dipping below 90FPS and even then only by one or two. The Fury and the Fury X held the most consistent gaming experience with VR, at this early stage.
There is another obvious advantage to having a faster card. While the latest generation of consumer grade VR headsets do not sport the 4K resolution+ screens we would need for a near-lifelike virtual reality experiences, they are detailed enough that having higher graphical settings in a game can make a difference with how immersive it feels.
The Fury X was able to deliver the best looking, smoothest experience in our testing. If you have the funds available, the Fury X is the best AMD card you can buy today for VR gaming.
Special thanks goes to Sapphire for sending us these cards to benchmark. We hope to follow up soon with a similar article featuring all Nvidia hardware.
Discuss on our Facebook page, over HERE.
KitGuru Says: All of the hardware on test today delivers a good VR experience, however the Fury X is the card to buy, if you have the money in the bank. The R9 390 is really the minimum you will want to accept, especially as more intensive VR titles are released later in the year. You risk a substandard VR experience and that is arguably worse than no VR at all. Nobody wants to feel nauseous when experiencing VR, so making sure you have the hardware to achieve 90fps+ at all times is critical.
 KitGuru KitGuru.net – Tech News | Hardware News | Hardware Reviews | IOS | Mobile | Gaming | Graphics Cards


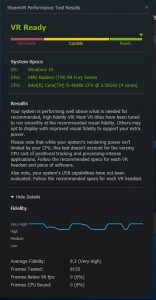
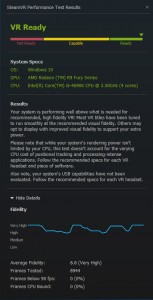
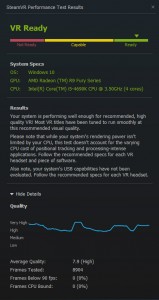
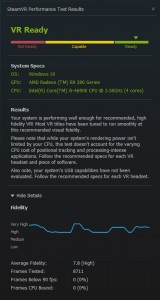
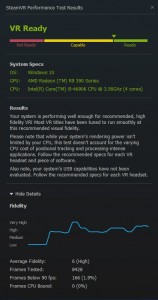

Here is mine though.
Just downloading Steams VR test so I can compare my gtx 970, will post score afterwards. I’d love to see how a 980ti scores if anyone can be bothered ?
If this is my 290x I’d expect a 980ti to be scoring as high as it can go (is that 10 or 11?)
I got 10.9, with an i7 instead of an i5 I’d get 11. 🙂
Here are some 980Ti results, I decided to give the benchmark a quick whirl myself:
Why do each and every one of these benchmarks have a different number of frames tested.
Here’s mine with a 4970k and R9 290X 4GB on stock clocks
I don’t get why the 390 only gets a 6 score, each 390 I’ve seen gets at least a 7.2 even on stock clocks
The higher your average fps the more frames that will be displayed in the time the benchmark runs. So people with higher average fps the more frames tested in the run.
They must use a weighted mean to determine the overall score.
That 6 score is odd.
You might think it was CPU bound or something, but here’s mine with a 5year old CPU… (4.2Ghz CPU OC though)
If that manages 6.6, i don’t see how they got a 6 score with a new i5…
*Facepalm.
Makes sense when you stop to think of it.
your CPU is taken into account on that, 4 cores vs 8 cores is a massive difference.
Weird just retested and got an average quality of 7.4 ! also the test seemed to be staying around 120fps.
Try the test again, I’ve had a different score each time on my 970. 1st 6.9, 2nd 7.4 3rd 7.0. The test doesn’t seem very accurate to me.
Yeah that doesn’t make sense. I never scored below 7 on mine. I don’t understand why they use a 650W power supply with the 390 and 390X. Sapphire recommend at least 750W with both of these cards, and VR really maxes out cards, so they may have been underpowered. I suspect that is the cause.
Also, I keep reading how FRAPS can’t actual measure accurately in VR, so I don’t know why people are using it. Tms Hrdwr used it but at least warned it may not be accurate, so why use it?
http://www.pcper.com/reviews/Graphics-Cards/Measuring-VR-Performance-and-Experiences-Prologue
http://www.tomshardware.co.uk/oculus-rift-virtual-reality-hmd,review-33509-6.html
Steam test only thing available until new 3D Mark and Crytek VR benchmarks are released.
Yes very odd. Also odd they would not use recommended minimum 750w power supply.